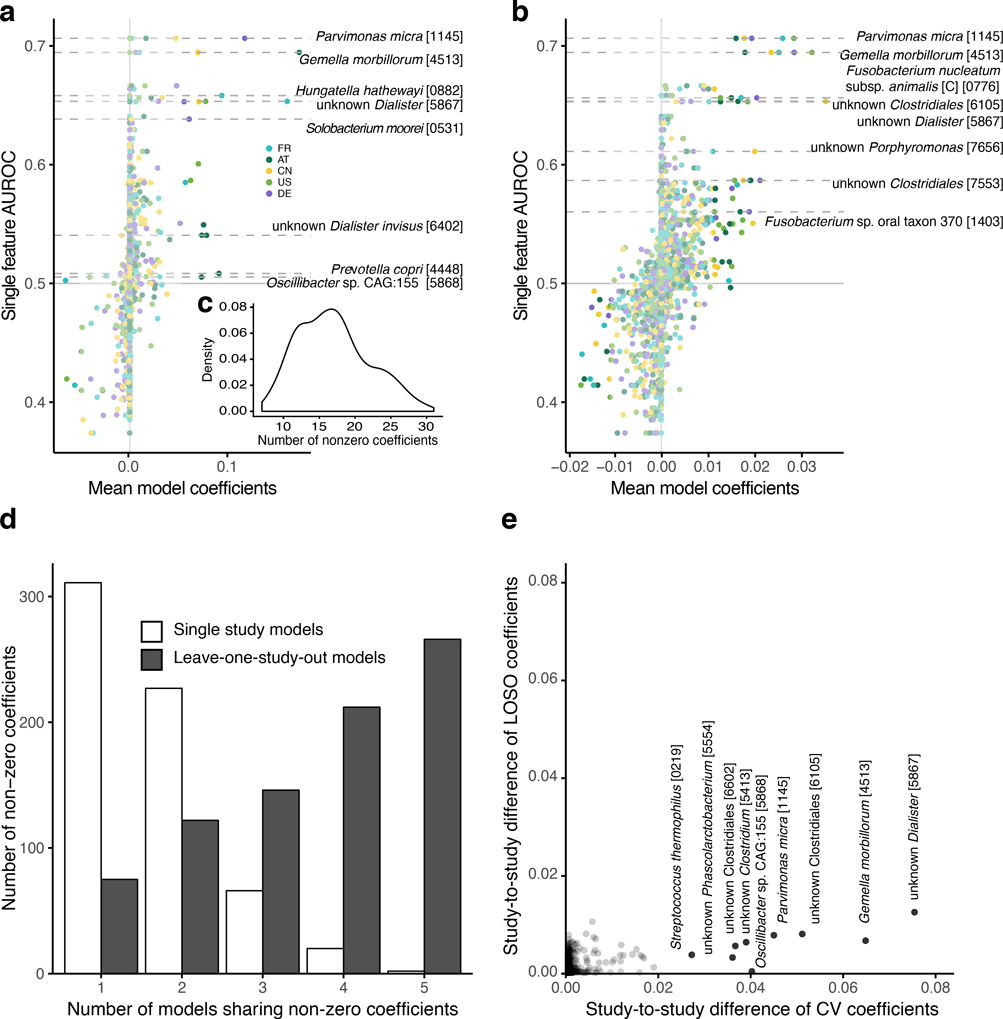
Extended Data Figure 6: Coefficients of leave-one-study-out LASSO logistic regression models compared to models trained on individual studies.
(a) Mean coefficients (feature weights) from LASSO cross-validation models traind on single studies (color-coded) are plotted against the single feature AUROC for each species feature. Horizontal lines highlight microbial species that are -for at least one study- selected in more than 50% of the models in cross-validation and account for more than 10% of the absolute model weight in at least 10% of the cross-validation models. Similarly, (b) shows the same for models trained in the leave-one-study-out (LOSO) setting (see Methods). Colors indicate which study has been left out of the the training set (and is used for validation). Since the weights of the LOSO models are spread across more species and thus generally lower, species are highlighted by horizontal lines if their weights explain more than 2.5% of the absolute model in at least 10% of cross-validation models and they have been selected in more than 50% of models in cross-validation. (c) Inset shows the distribution of the number of non-zero coefficients across all cross-validation models. (d) Bar height indicates the number of non-zero coefficients that are shared between the mean models for each study or left-out study, respectively. (e) The study-to-study difference (computed as median of all pairwise differences between model weights for a single species across the mean models) for cross-validation (CV) single-study models are plotted against the same measure for the LOSO models. Species with a study-to-study difference of more than 0.02 in the cross-validation models are highlighted and annotated, showing much larger variability between models trained on single studies compared to LOSO models.

