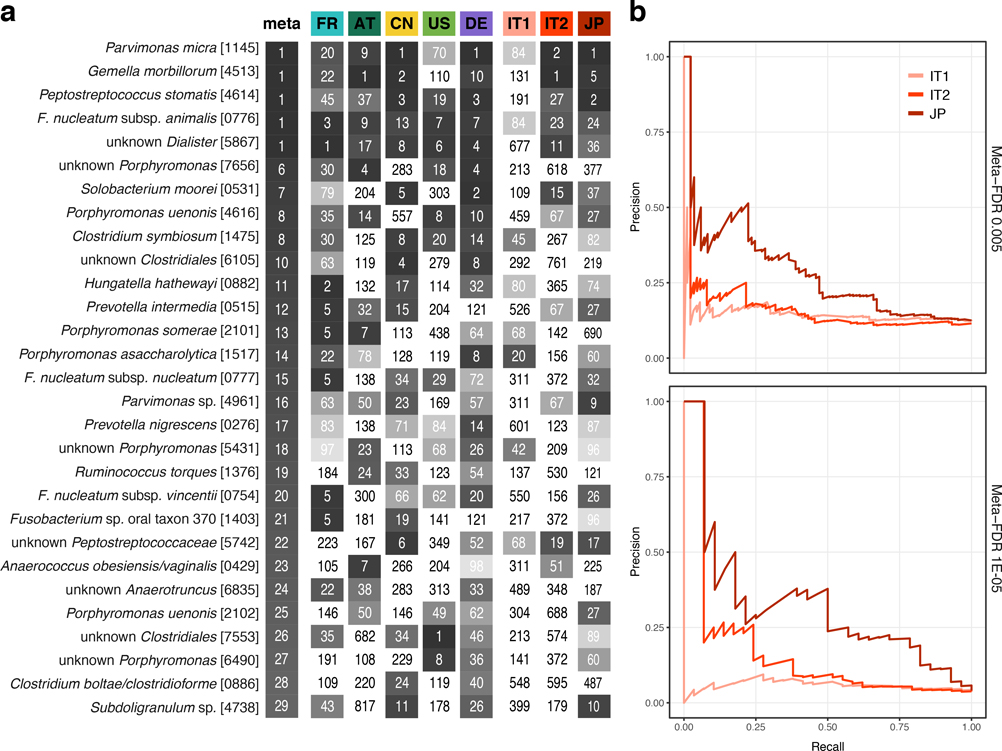
Extended Data Figure 10: Validation of meta-analysis single species associations in three independent cohorts.
(a) Heatmap showing for the core set of CRC-associated species (see Fig. 1) the rank of the respective species within the associations of each study (tested by two-sided Wilcoxon test), including the three independent validation cohorts (see Table 1), compared to the rank in the meta-analysis (meta, tested by two-sided blocked Wilcoxon test) on the left. (b) Precision-recall curves for the different independent validation cohorts using the meta-analysis set of associated species at FDR 0.005 (n=94, top) and 1E-05 (n=29, bottom) as “true” set (tested by two-sided blocked Wilcoxon test, see Methods) and the naïve (uncorrected) within-cohort significance (tested by two-sided Wilcoxon test) as predictor (see Supplementary Figure X).

