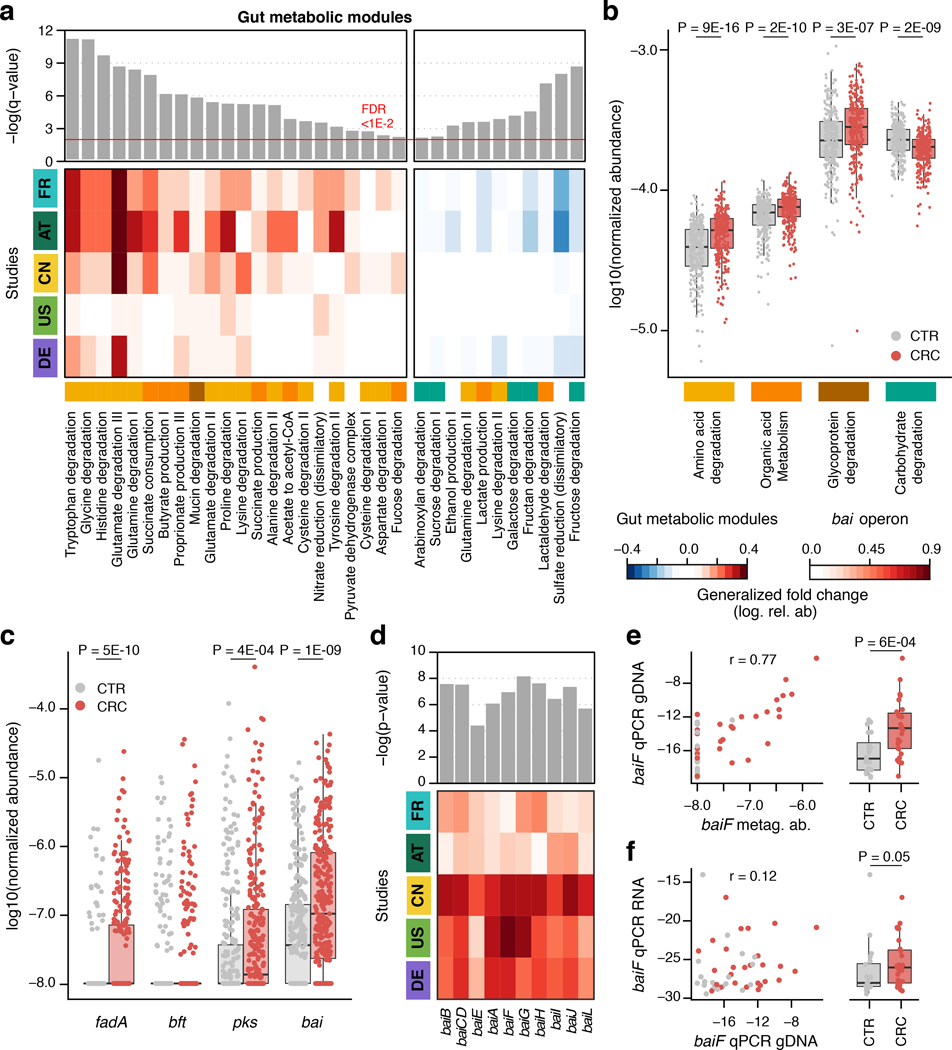
Figure 4. Meta-analysis identifies consistent functional changes in CRC metagenomes.
(a) Meta-analysis significance of gut metabolic modules derived from blocked Wilcoxon tests (n=574 independent samples) is indicated by bar height (top panel, FDR of 0.01). Underneath, the generalized fold change (Methods) for gut metabolic modules [31] within individual studies is displayed as heatmap (see color key below (b)). Metabolic modules are ordered by significance and direction of change. A higher-level classification of the modules is color-coded below the heatmap for the four most common categories (colors as in (b), white indicating other classes). (b) Normalized log abundances for these selected functional categories is compared between controls (CTR) and colorectal cancer cases (CRC). Abundances are summarized as geometric mean of all modules in the respective category and statistical significance determined using blocked Wilcoxon tests (n=574 independent samples, see Methods). (c) Normalized log abundances for virulence factors and toxins compared between metagenomes of controls (CTR) and colorectal cancer cases (CRC) (significant differences P < 0.05 were determined by blocked Wilcoxon test, n=574 independent samples, see Methods for gene identification and quantification in metagenomes; fadA: gene encoding Fusobacterium nucleatum adhesion protein A, bft: gene encoding Bacteroides fragilis enterotoxin, pks: genomic island in Escherichia coli encoding enzymes for the production of genotoxic colibactin, and bai: bile acid inducible operon present in some Clostridiales species encoding bile acid converting enzymes). (d) Meta-analysis significance (uncorrected P-value) as determined by blocked Wilcoxon tests (n=574 independent samples) and generalized fold change within individual studies are displayed as bars and heatmap, respectively, for the genes contained in the bai operon. Due to high sequence similarity to baiF, baiK was not independently detectable with our approach. (e) Metagenomic quantification of baiF (metag. ab. – normalized relative abundance) is plotted against qPCR quantification in genomic DNA (gDNA) extracted from a subset of DE samples (n=47), with Pearson correlation (r) indicated (see Methods). (f) Expression of baiF determined via qPCR on reverse-transcribed RNA from the same samples in contrast to genomic DNA (as in e). The boxplots on the side of (e), (f) show the difference between cancer (CRC) and control (CTR) samples in the respective qPCR quantification (P-values on top were computed using a one-sided Wilcoxon test). All boxplots show interquartile ranges (IQR) as boxes with the median as a black horizontal line and whiskers extending up to the most extreme points within 1.5-fold IQR.

