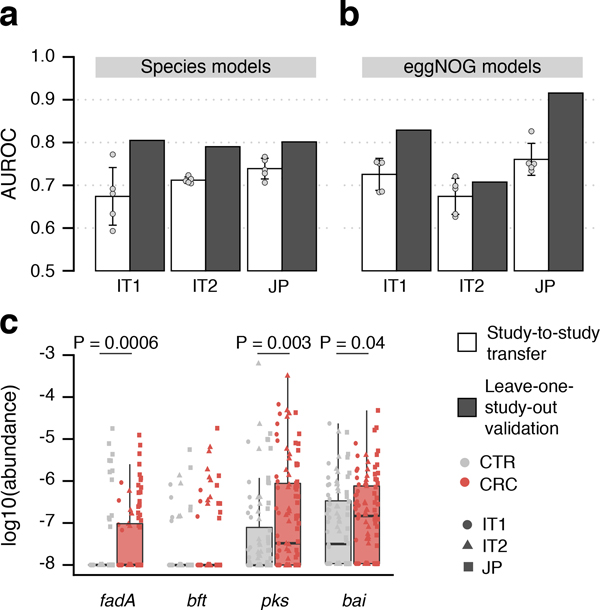
Figure 5. Meta-analysis results are validated in three independent study populations.
CRC classification accuracy for independent datasets, two from Italy and one from Japan (see Supplementary Table S2), is indicated by bar height for single study (white) and leave-one-study-out (grey) models using either (a) species or (b) eggNOG gene family abundance profiles (cf. Fig. 3). Bar height for single study models corresponds to the average of five classifiers (error bars indicate standard deviation, n=5). (c) Normalized log abundances for virulence factors and toxins (cf. Figure 4c) compared between controls (CTR) and colorectal cancer cases (CRC). P-values were determined by blocked, one-sided Wilcoxon tests (n=193 independent samples). Boxes represent interquartile ranges (IQR) with the median as a black horizontal line and whiskers extending up to the most extreme points within 1.5-fold IQR.

