
Figure 9.
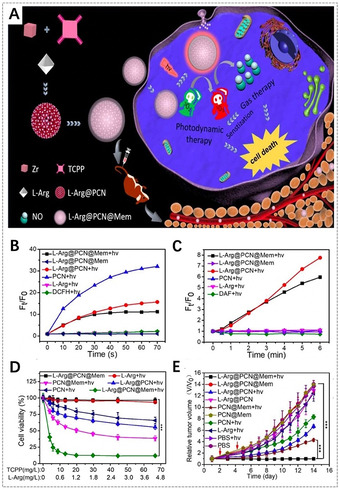
A) Illustration of l‐Arg‐incorporated PCN‐224 NMOFs for combined gas therapy and PDT. B) ROS generation in different groups detected by a 2′,7′‐dichlorofluorescin diacetate (DCFH‐DA) probe. C) NO generation in different groups. D) In vitro cytotoxicity of 4T1 cells after different treatments. E) Changes of relative tumor volume in vivo after various treatments (red arrows refer to the light irradiation time points). (A–E) Reproduced with permission. [52c] Copyright 2018, Elsevier Ltd.