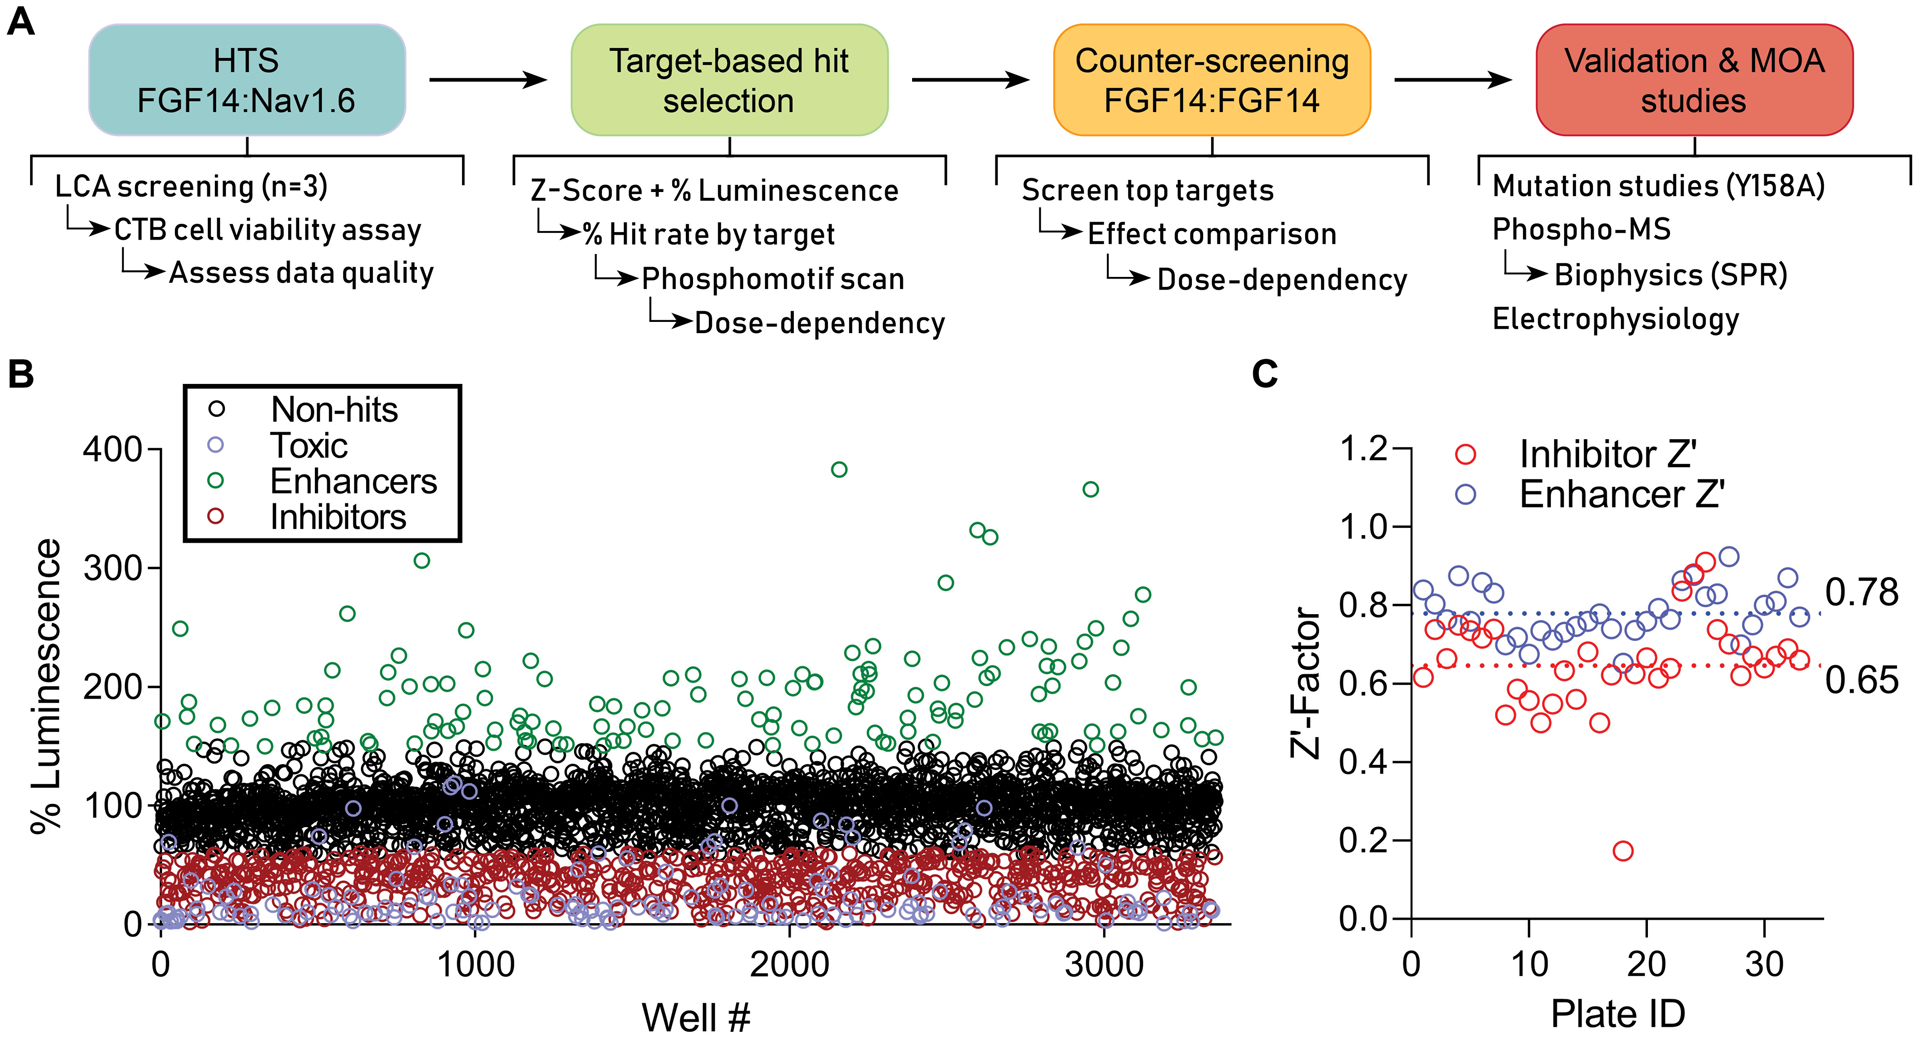
Figure 1. HTS pipeline and results for discerning mechanisms of Nav channel complex regulation by kinases.

(A) Screening and validation pipeline. (B) Double stable HEK293 cells expressing CLuc-FGF14 and CD4-Nav1.6-NLuc were plated in 384-well plates and treated with kinase inhibitors (n = 1 compound/well) from the Broad, Selleck, and UTKinase collections, with each plate screened in triplicate. The mean percent luminescence (normalized to on-plate 0.3% DMSO controls) is shown for each compound. Following exclusion of toxic compounds (purple), hits were initially selected using unbiased criteria of change in FGF14:Nav1.6 complex assembly by at least 40% (i.e., % luminescence > 140% or < 60%) and Z-score ≥ 3 (enhancers, green) or Z-score ≤ −4 (inhibitors, red). (C) Z’-Factor (Z’) for each screened library plate, calculated using either the inhibitor (red) or enhancer (blue) positive controls as described previously[25]. A total of 33 plates were screened, including 6 from Broad, 12 from Selleck, and 15 from UTKinase, for a total of 3,120 compounds.
