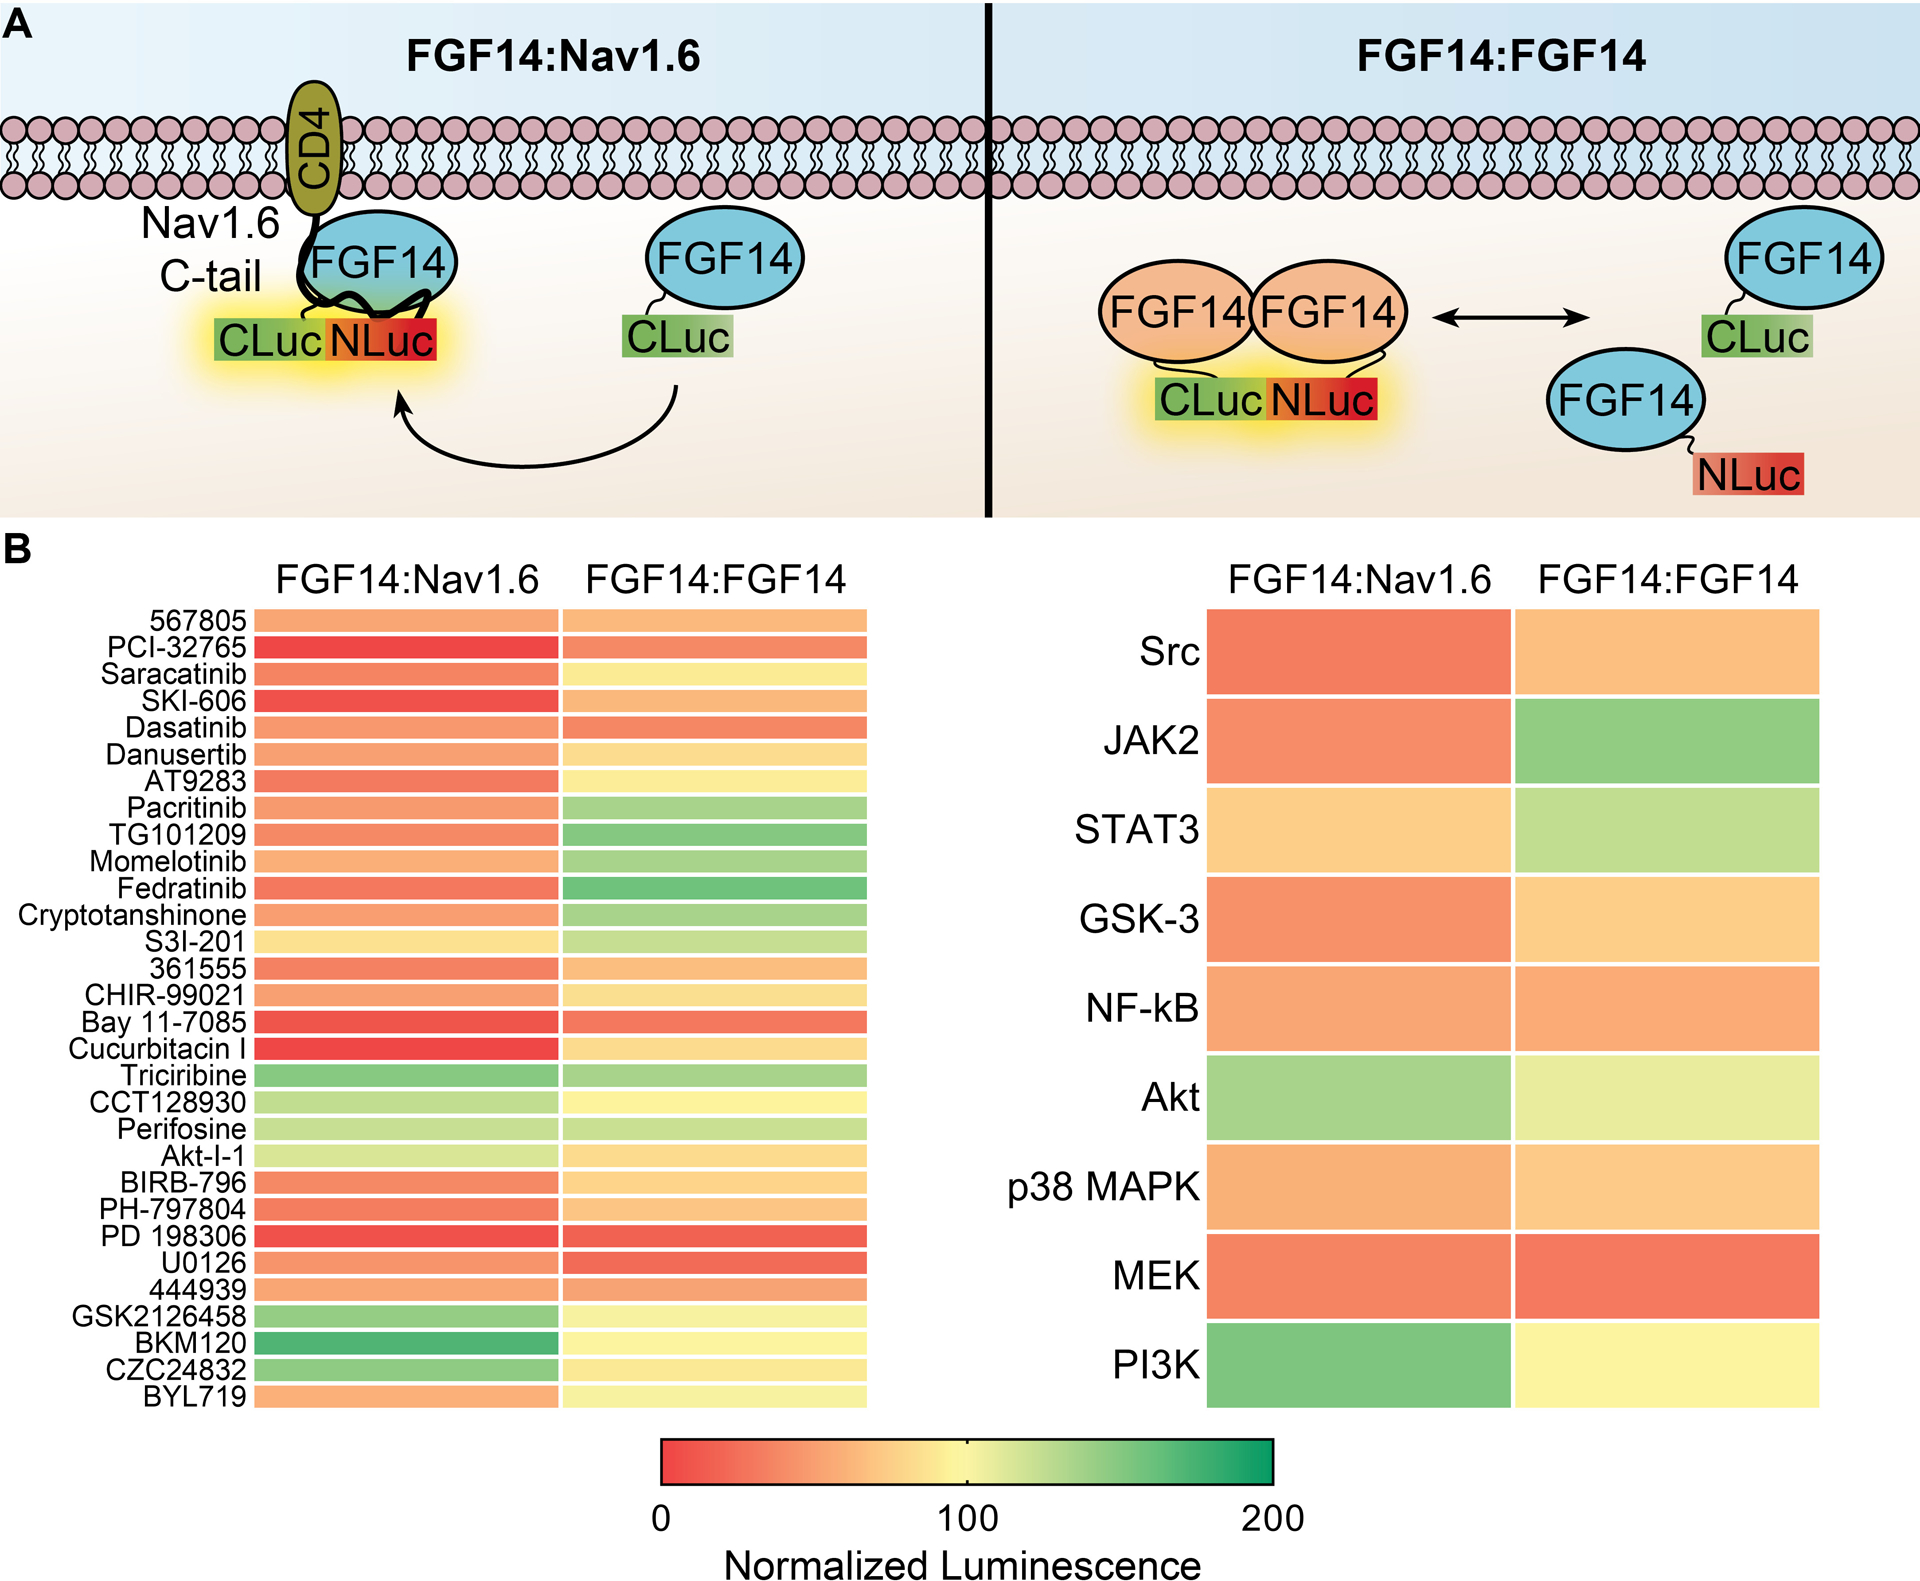
Figure 3. Counter-screening of inhibitors for top kinase targets against the FGF14:FGF14 dimer.

(A) Cartoon representation of hypothesized interactions occurring in LCA for the FGF14:Nav1.6 (left) vs. FGF14:FGF14 dimer (right). (B) Kinases targeted by ≥4 hits from the HTS against the FGF14:Nav1.6 complex that also revealed phosphorylation or binding motifs (or those of upstream pathways, such as Akt) in FGF14 were counter-screened against the FGF14:FGF14 dimer, using ≥2 selected compounds per target based on selectivity, potency, and availability. Left, heatmap of mean normalized luminescence for individual compounds tested against either the FGF14:Nav1.6 complex (represented in panel A, left) or FGF14:FGF14 dimer (represented in panel A, right). For counter-screening, transiently transfected HEK293 cells were seeded in 384-well plates and treated with 0.3% DMSO (n = 32) or kinase inhibitors (30 μM; n = 3 per compound). Right, the mean percent luminescence from all compounds for each kinase group is shown as a heat map for the two complexes. Note that only JAK2 inhibitors demonstrated a consistent and opposing response between the FGF14:Nav1.6 complex and FGF14:FGF14 dimer. Individual values and statistical analysis for these data are shown in Suppl. Fig. 4.
