
Figure 1.
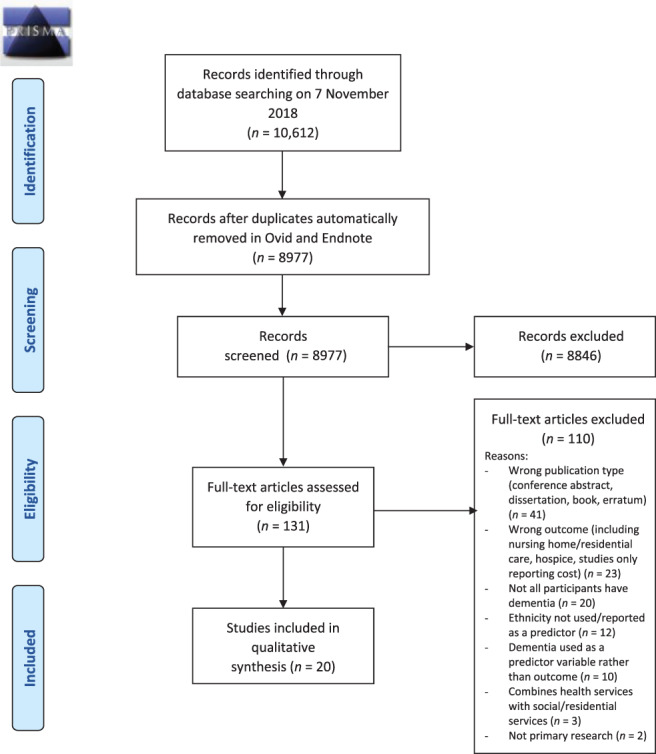
PRISMA flow diagram. This figure depicts the process used to identify and screen articles found in the search, including numbers of papers excluded and exclusion reasons for full‐text articles.
Official websites use .gov
A
.gov website belongs to an official
government organization in the United States.
Secure .gov websites use HTTPS
A lock (
) or https:// means you've safely
connected to the .gov website. Share sensitive
information only on official, secure websites.
PRISMA flow diagram. This figure depicts the process used to identify and screen articles found in the search, including numbers of papers excluded and exclusion reasons for full‐text articles.