
FIGURE 3.
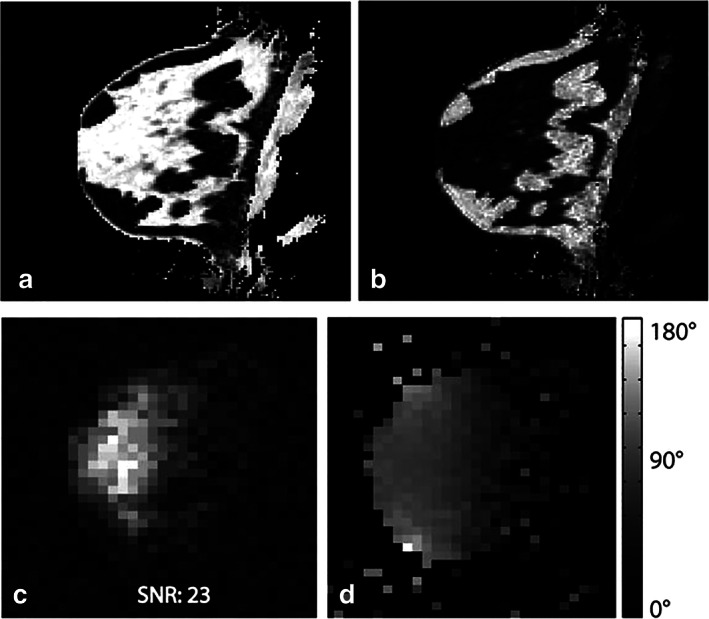
Proton three‐point Dixon water (a) and fat (b) image of the breast of a healthy volunteer. The corresponding sodium magnitude image is shown in (c), showing a good correlation with breast anatomy (high sodium concentration in fibroglandular tissue and lower concentration in fatty tissue). A 3D sodium B1 map using the phase‐sensitive method is shown in (d). The phase‐sensitive method yields a high‐quality B1 map in vivo despite low sodium image SNR. Representative figure reproduced from Ref. 43, with permission from John Wiley & Sons, Magnetic Resonance in Medicine.