
FIGURE 5.
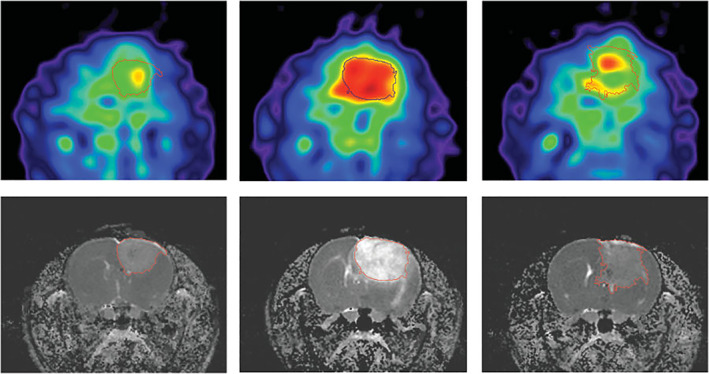
BCNU‐treated 9L rat glioma. Sodium MRI (top) and proton ADC maps (bottom) acquired at days 0, 7, and 23 (left to right) after BCNU injection, performed at the 17th day from tumor implantation. Central Na image at day 7 illustrates the main feature for all treated animals: A dramatic Na concentration increase observed throughout the entire tumor area. The images on day 23 show tumor during regrowth after tumor‐shrinking started at day 9 and its maximum regression on day 16. Reproduced from Ref. 56 with permission from John Wiley & Sons, Magnetic Resonance in Medicine.