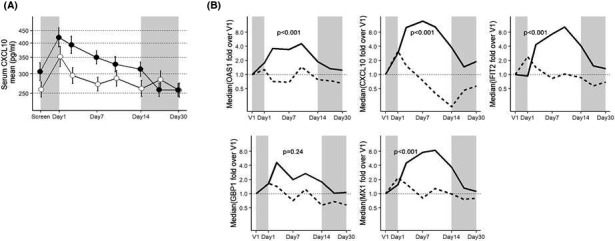
Figure 5.

Pharmacodynamic effect of AZD9412 based on IFN‐response biomarkers. A, Mean serum CXCL10 concentrations throughout the study time course. Error bars are SEM. Closed circles: AZD9412; open circles: placebo. B, Median mRNA levels of sputum IFN‐stimulated genes throughout the treatment and follow‐up period. For each gene, mRNA levels are normalized to housekeeping genes (PUM1, ACTB and HPRT) and expressed as fold change over day 1 (V1). Solid line: AZD9412; dashed line: placebo. Shaded areas indicate the pre‐treatment waiting phase from screening to randomization (left area), and follow‐up period (right area)
