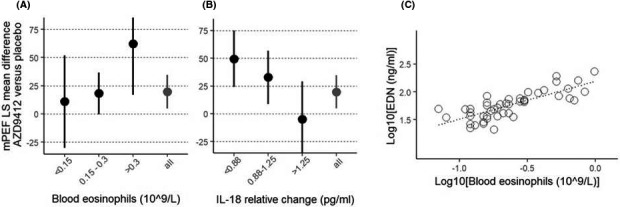
Figure 6.

A, Mean mPEF AUC change (day 1‐7) in patients sub‐divided on blood eosinophil counts at screening. Patient numbers in low, mid and high subgroups were 9, 32 and 12 for AZD9412 and 19, 27 and 12 for placebo. B, Mean mPEF AUC change (day 1‐7) in patients sub‐divided on mean IL‐18 relative change from screening to treatment baseline. Patient numbers in low, mid and high subgroups were n = 14, 29 and 13 for AZD9412, and n = 14, 30 and 13 for placebo. A‐B, All = main ITT population. Error bars are 95% confidence intervals. C, Scatterplot of blood eosinophil counts versus EDN (log10‐scale) based on all patients with both EDN and eosinophil count data at screening (n = 47, excluding one patient whose blood eosinophil count = 0 and 3 patients with missing eosinophil count data). Correlation between EDN and blood eosinophil counts (log10‐scale) is 0.78 (Pearson's correlation coefficient)
