
Figure 1. PT and PcephPT increase cellular Cu+ levels.
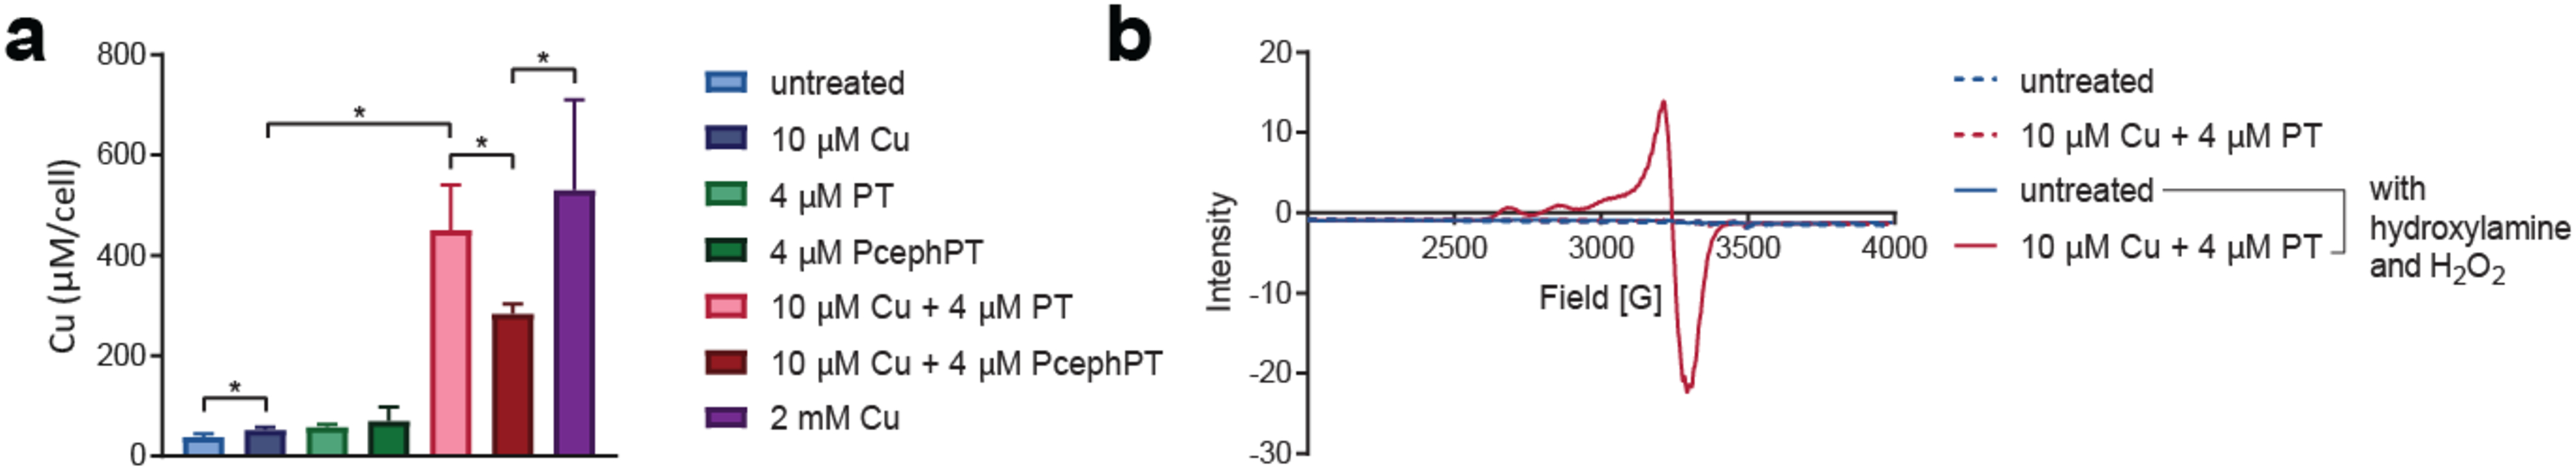
a, ICP-MS data comparing cellular Cu content of E. coli MG1655 CTX-M-1 grown to OD600 of 0.1–0.2 and treated for 15 min. * indicates p < 0.05 using a one-tailed Student’s t test. b, Whole cell EPR spectra of E. coli MG1655 CTX-M-1 grown to OD600 of 0.8–1 and treated for 15 min with Cu and PT as indicated. Treated cell pellets subsequently oxidized with H2O2 (1 M) plus catalase inhibitor hydroxylamine (1 mM) displayed a 4-line signal (g∥ = 2.28, g⊥ = 2.06) attributable to Cu2+. Spectra obtained at 77 K.