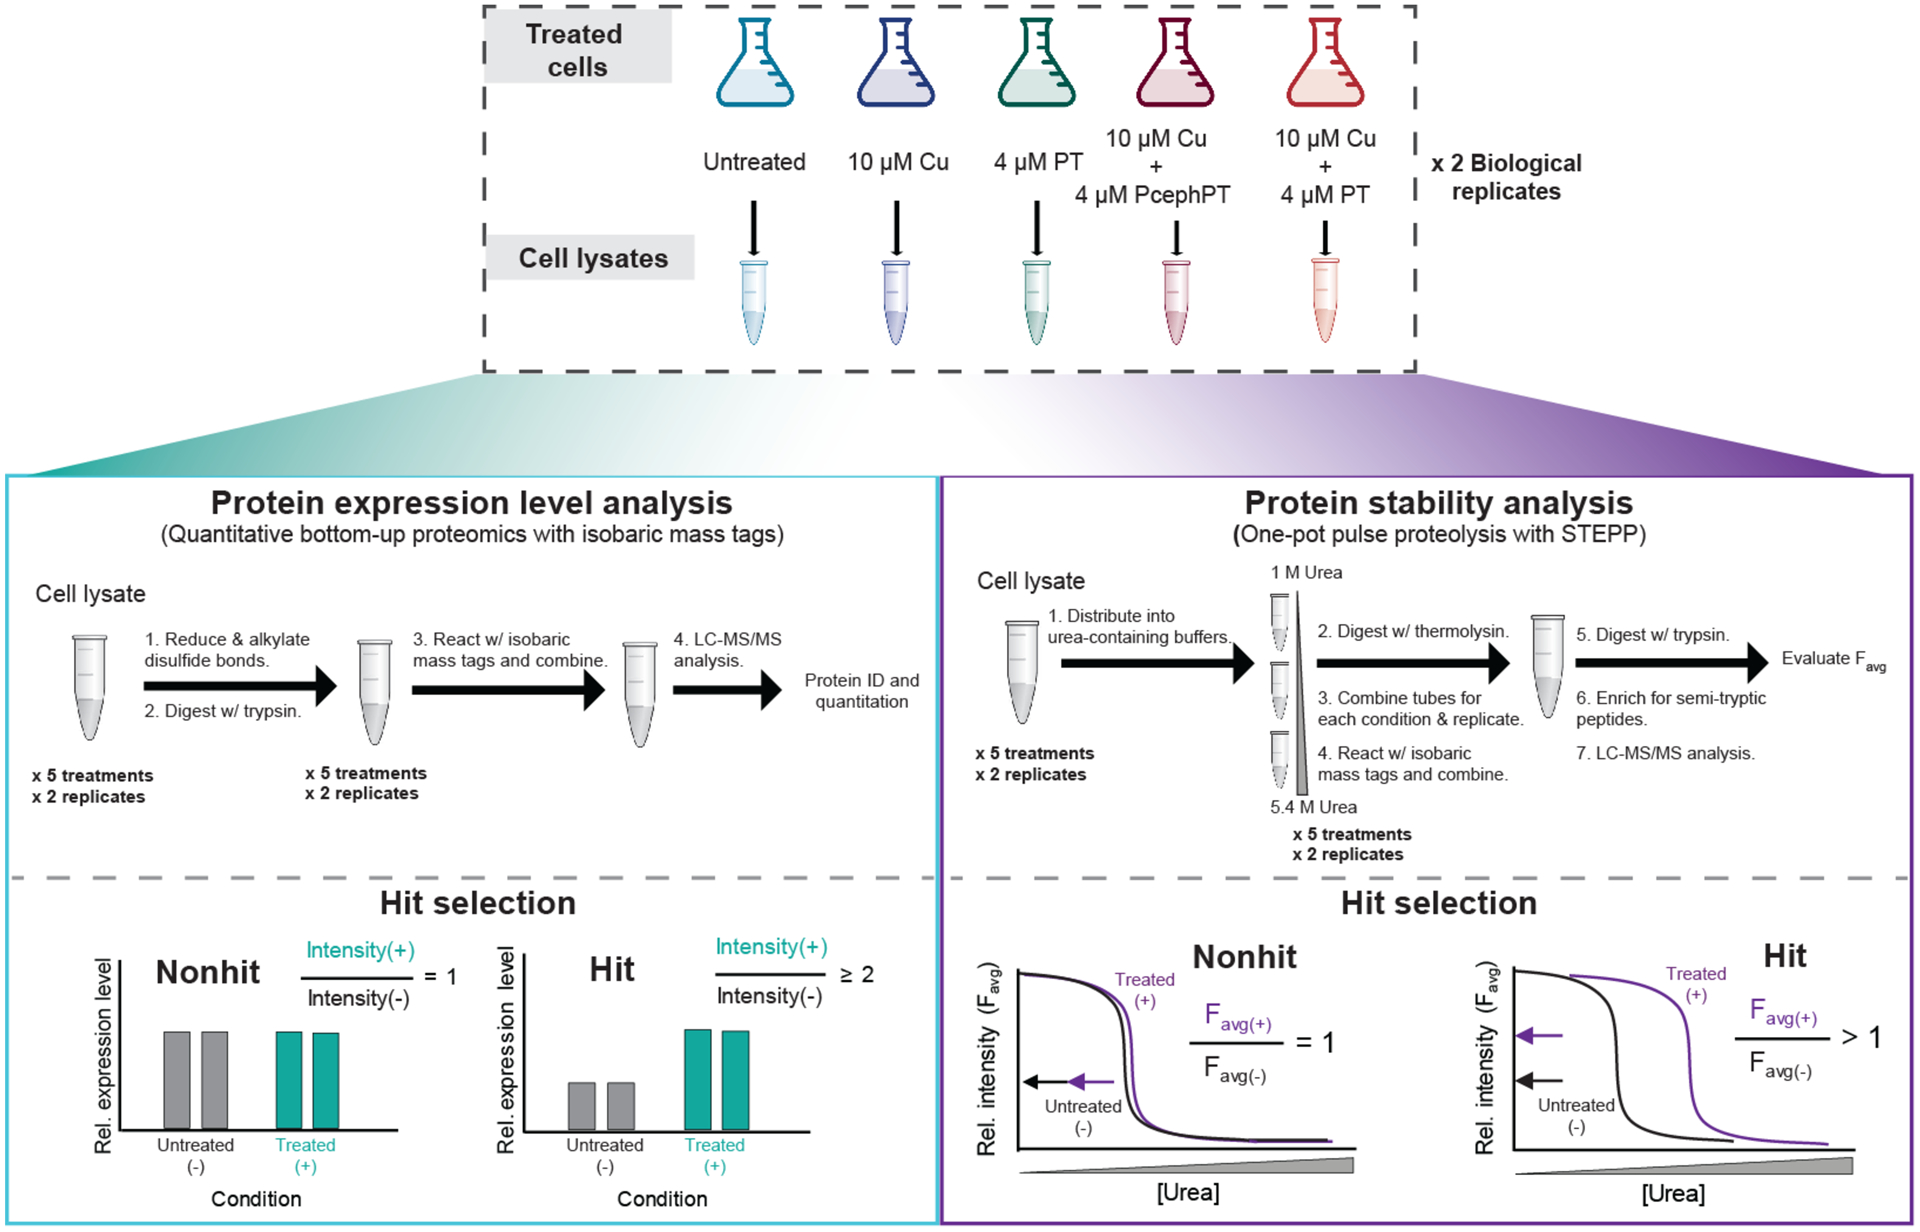
Figure 2. Experimental workflows for protein expression level (left box) and protein stability (right box) analyses.

Top, E. coli MG1655 CTX-M-1 were grown to OD600 of 0.1–0.2, treated as indicated for 15 min, and harvested. Clarified lysate from the pellets was utilized in the proteomics workflows. Left side, A total of four biological replicates of the protein expression level analysis were performed using a traditional bottom-up proteomics workflow with an isobaric mass tagging strategy. Right side, A total of four biological replicates of the STEPP-PP technique were performed using a “one-pot” strategy, a technique we have previously reported.35 For each workflow, a total of two biological replicates per treatment condition were analyzed in one LC-MS/MS sample using the isobaric mass tagging strategy employed here. Each workflow was performed twice, resulting in four biological replicates per treatment condition. See Supplementary Figures 2 and 3 for detailed descriptions of the isobaric mass tagging schemes.
