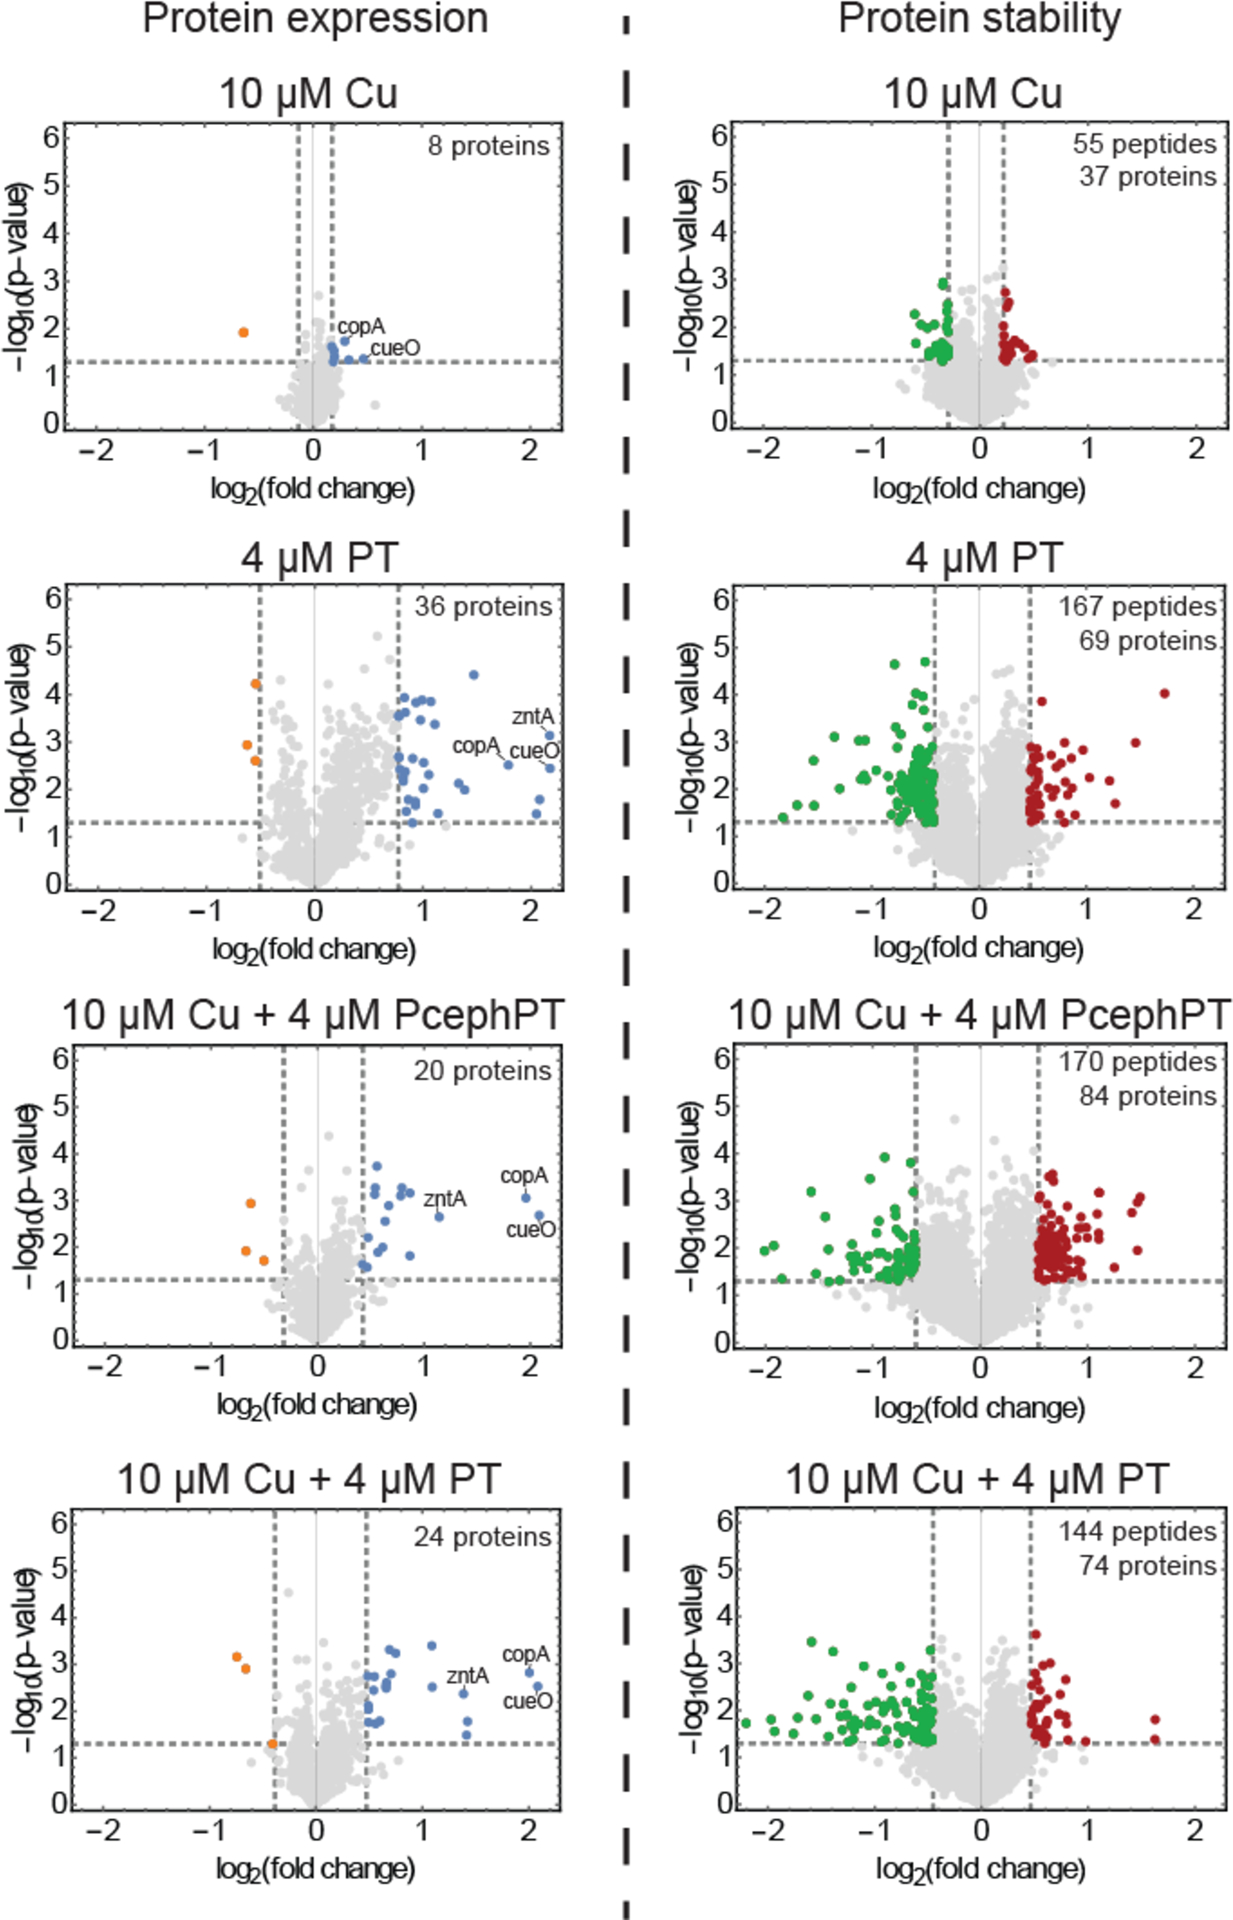
Figure 3.

Protein expression level analysis (left) and protein stability analysis (right) of E. coli cells treated under different conditions. Gray lines represent criteria used for selection of differentially expressed and differentially stabilized proteins (|protein or peptide log2(fold change)| ≥ 2 STDEV from average log2(fold change), p ≤ 0.05). Blue and orange dots represent hit proteins that passed the selection criteria for overexpression and underexpression, respectively. Green (stabilized) or red (destabilized) dots represent hit peptides that passed the selection criteria for significantly altered stability changes. Known metal detoxification proteins are labeled in the protein expression volcano plots.
