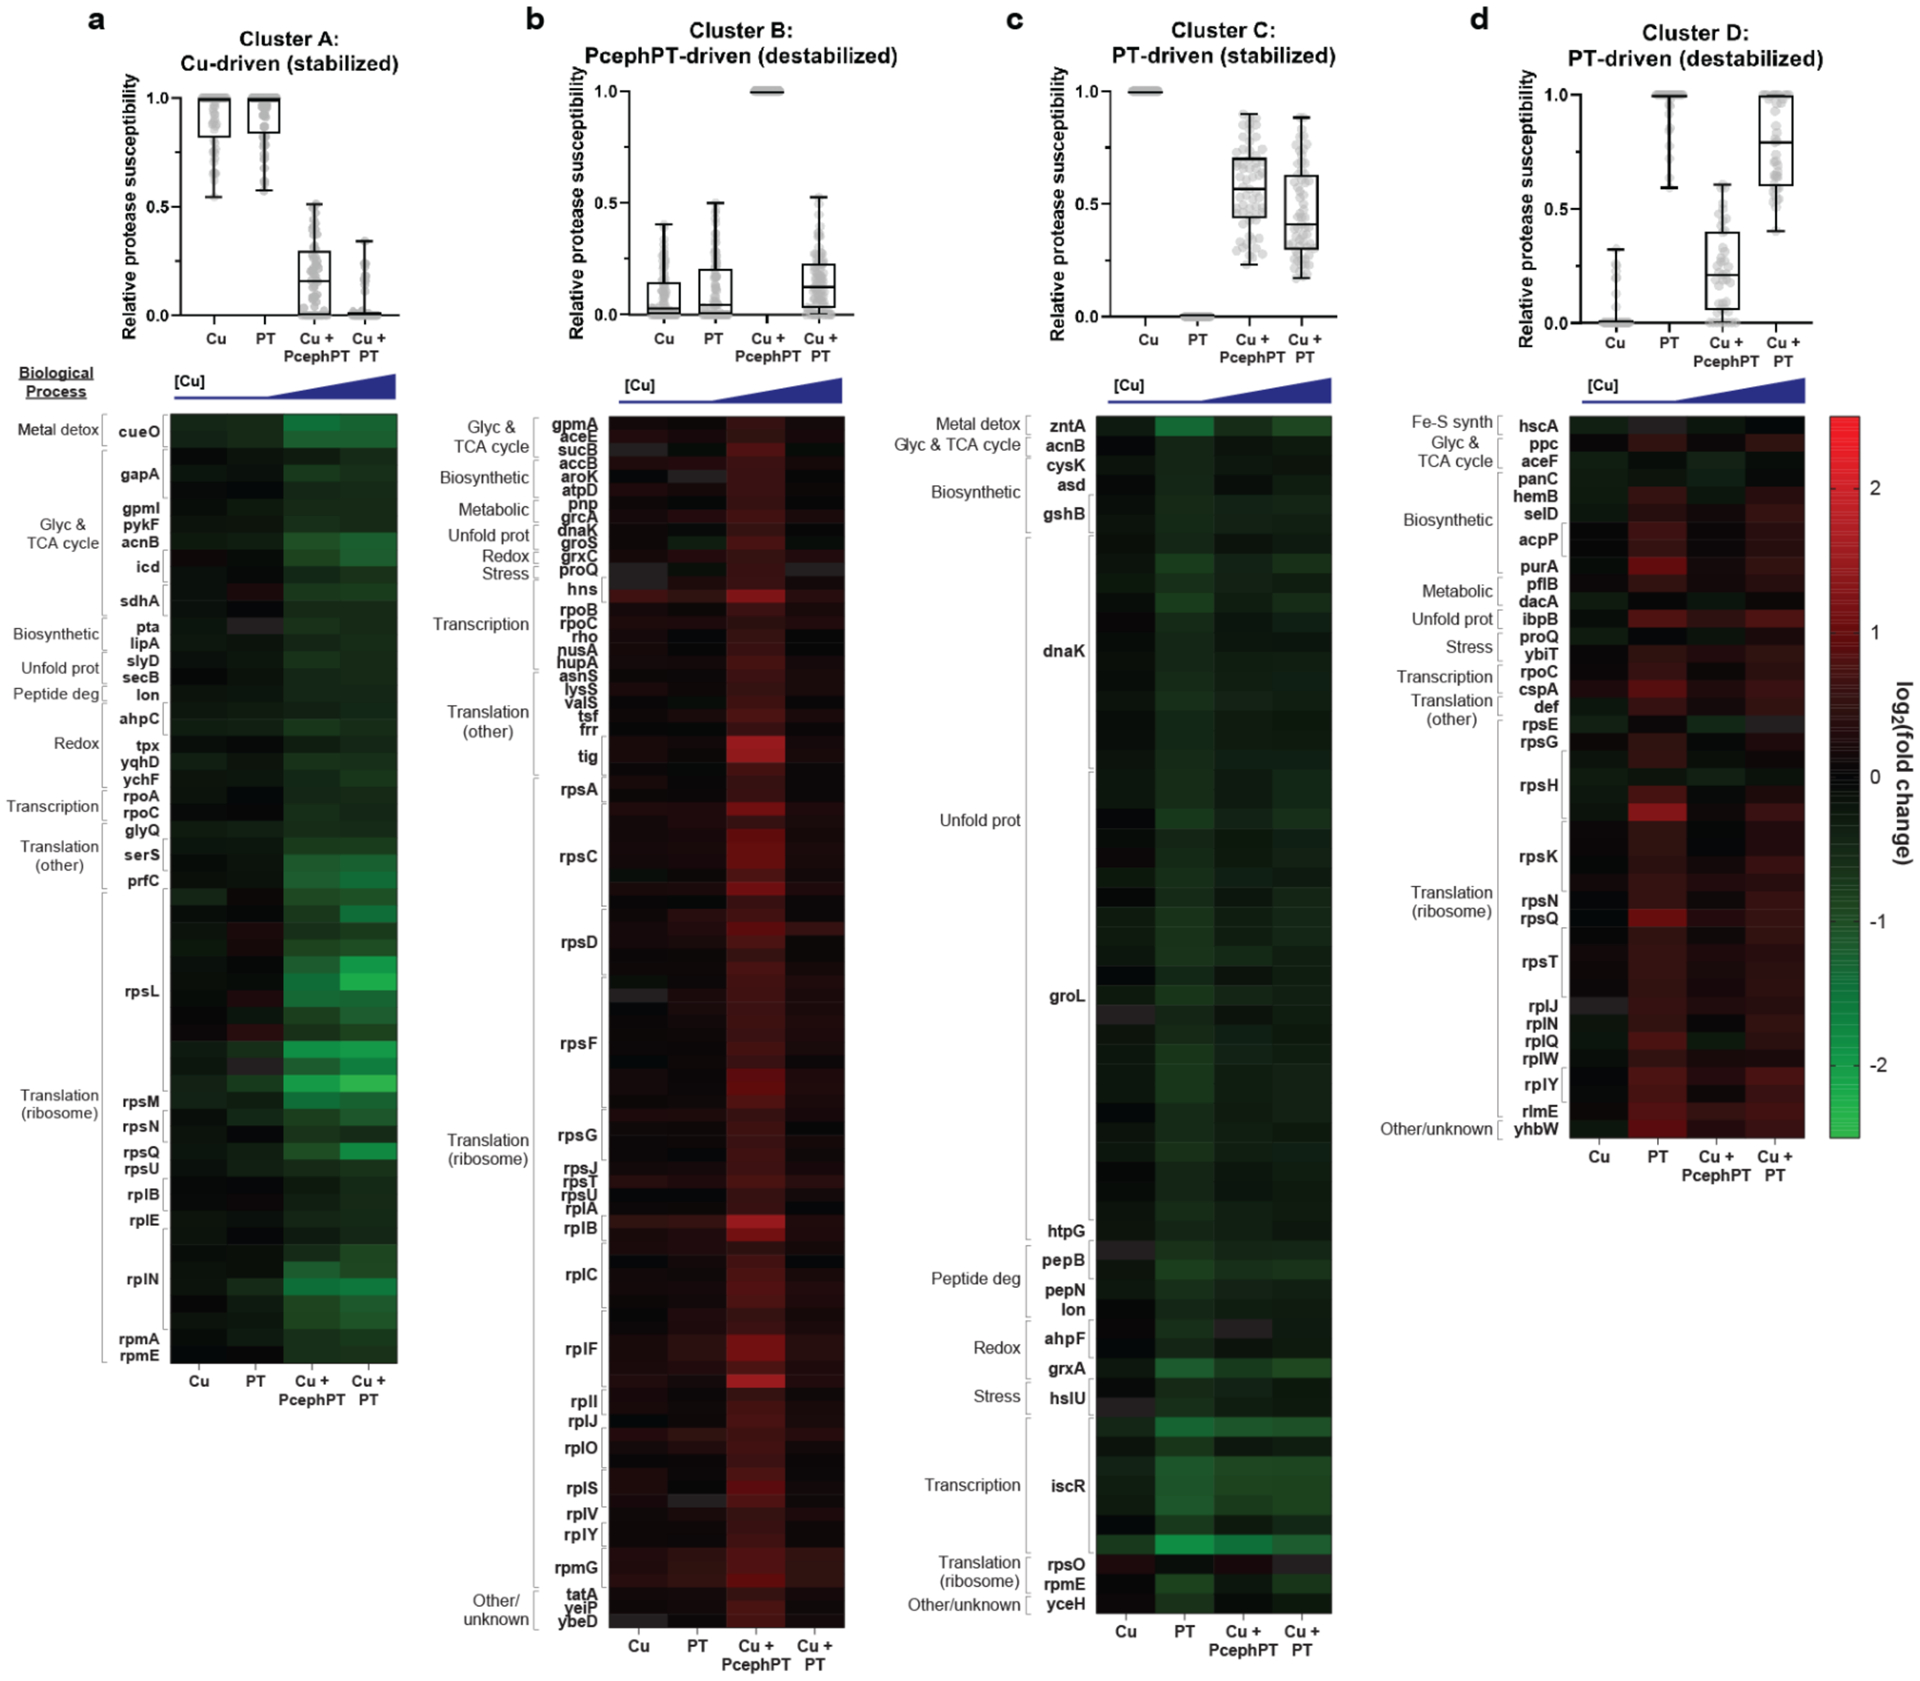
Figure 4. Hit peptides clustered according to their stability change trends.

Fuzzy c-means clustering identified four clusters that described the behavior of ~60% of peptide hits mapping to ~100 proteins. For each cluster, a graph indicating the relative protease susceptibility of member peptides is shown above a heatmap displaying the raw log2(fold change) of member peptides. Genes codes corresponding to member proteins are shown to the left of each heatmap. a, Peptides in cluster A exhibit decreased protease susceptibility (indicating protein stabilization) as a consequence of increased cellular Cu. b, Peptides in cluster B exhibit increased protease susceptibility (protein destabilization) in the treatment condition that includes PcephPT. c, Peptides in cluster C exhibit decreased protease susceptibility (protein stabilization) most significantly in the PT alone condition, and partially in conditions containing PT and PcephPT in the presence of Cu. d, Peptides in cluster D exhibit increased protease susceptibility (protein destabilization) most significantly in the PT alone condition, and partially in conditions containing PT and PcephPT in the presence of Cu. Within each heatmap, peptides are grouped according to their biological process GO terms (see also Supplementary Table 5).
