
FIGURE 2.
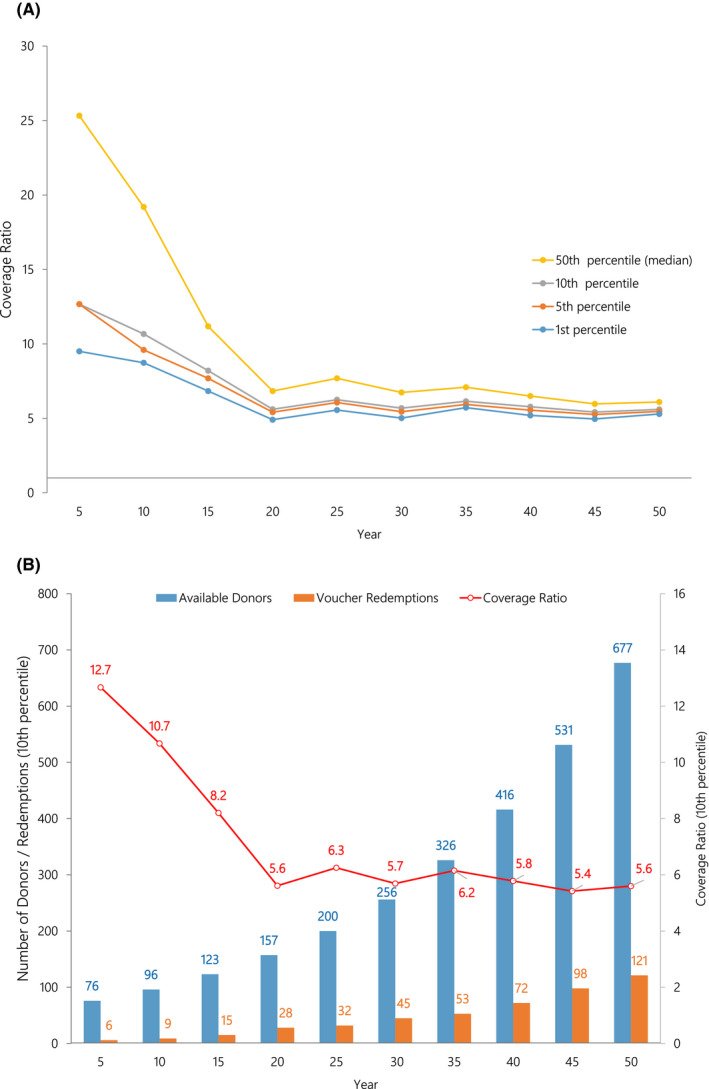
A, In the rapid growth scenario, coverage ratios at the first, fifth, 10th, and 50th percentiles are illustrated (1000 simulations). The coverage ratio is the number of available donors per voucher redemption. A coverage ratio of 2.0 indicates there are twice as many donor kidneys available as there are voucher redemptions in that year. B, In the rapid growth scenario, total available donors, voucher redemptions, along with the coverage ratio at the 10th percentiles are illustrated (1000 simulations)