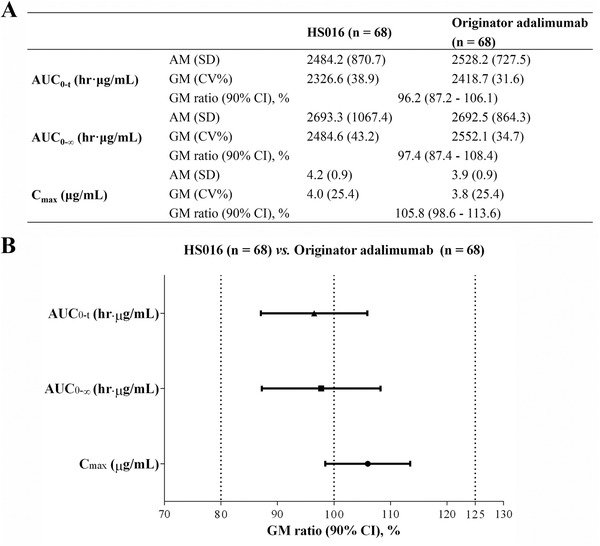
Figure 1.

GM (CV%) (A) and Forest plot (B) showing point estimates and the 90%CIs of AUC0‐t, AUC0‐∞, and Cmax for HS016 and adalimumab (bioequivalence was declared if the 90%CIs were within the prespecified margins of 80% to 125%). AM indicates arithmetic mean; AUC0‐t, the area under the plasma concentration‐time curve (AUC) from time 0 to the last detectable drug concentration; AUC0‐∞, AUC from time 0 extrapolated to infinity; Cmax, maximum plasma concentration; CV, coefficient of variation; GM, geometric mean.
