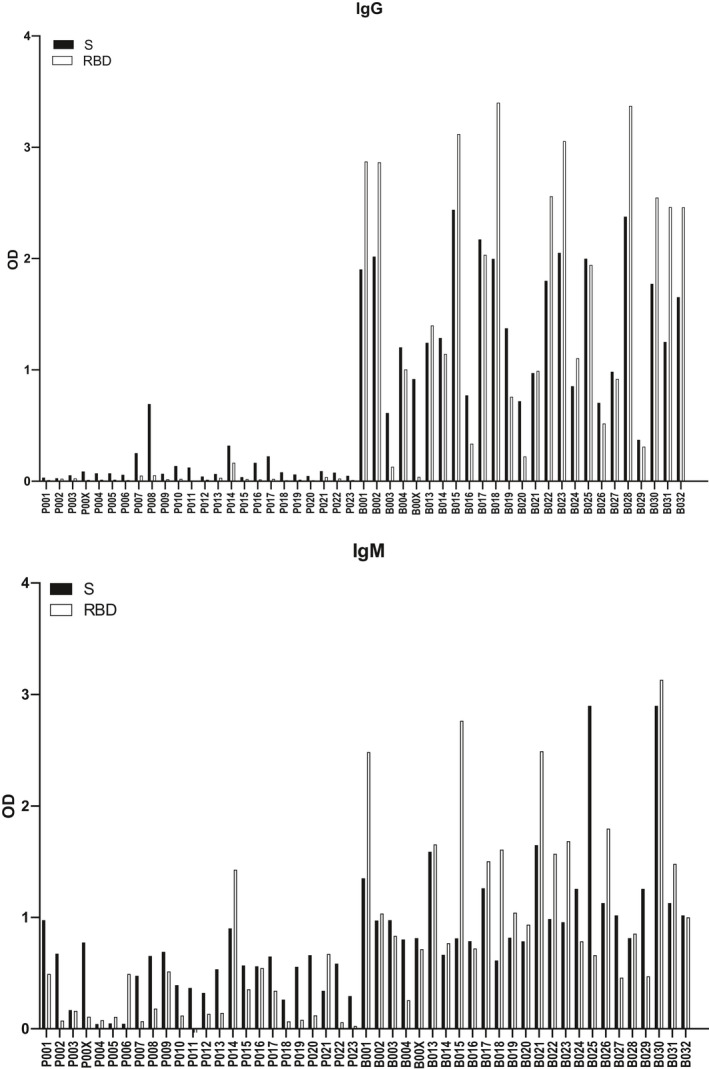
FIGURE 1.

IgG (upper panel) and IgM (lower panel) reactivity (y‐axis: OD values corresponding to bound immunoglobulin) to S and RBD determined for COVID‐19 convalescent patients (group B: B001‐B032, right) and for individuals from a historic control group before the pandemic (group P: P001‐P023, left). The threshold for background has been subtracted
