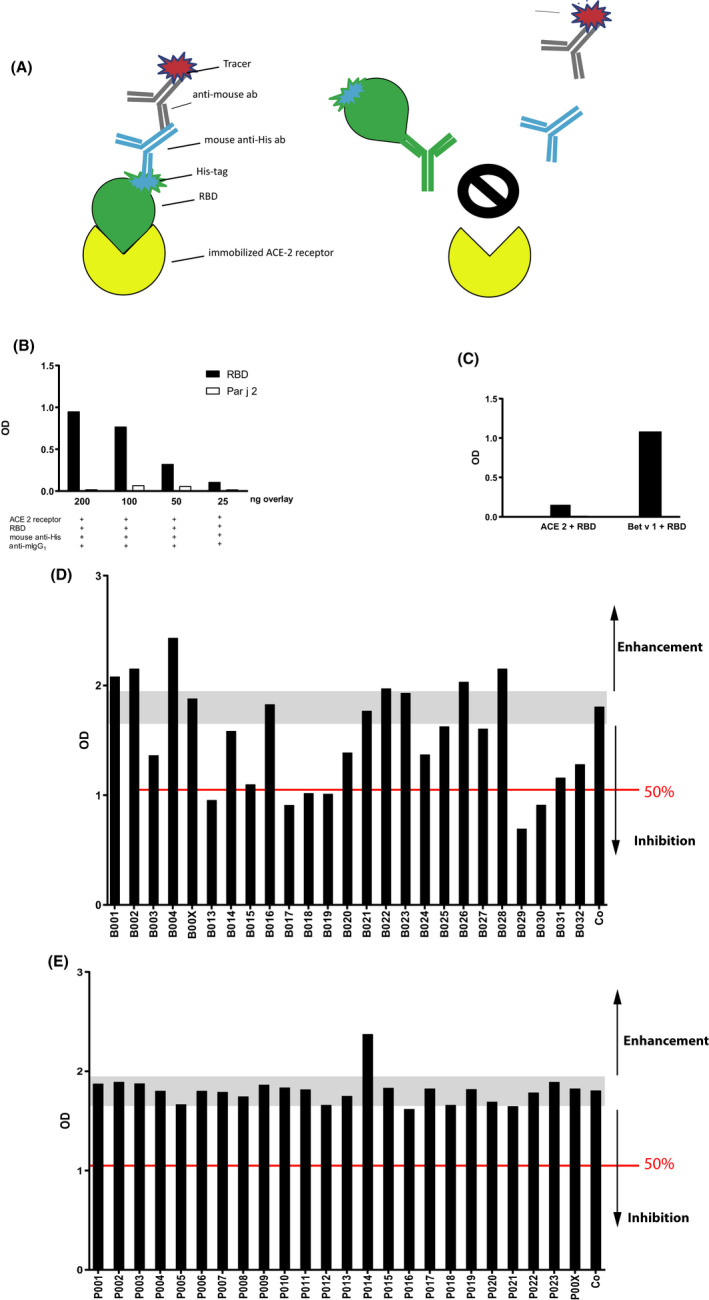
FIGURE 2.

Molecular interaction assay based on ACE2 and SARS‐CoV‐2 RBD. (A) Scheme of the molecular interaction assay. ELISA plate‐bound recombinant ACE2 is incubated with His‐tagged recombinant SARS‐CoV‐2 RBD which is detected with a mouse monoclonal anti‐His‐tag antibody followed by HRP‐labelled anti‐mouse antibodies. (B) Specific binding of three different concentrations of RBD vs a control protein (Par j 2) (y‐axis: OD values correspond to bound RBD) to ACE2. Reactants and concentrations in ng/ml are summarized below the x‐axis. (C) Inhibition of RBD binding (y‐axis: OD values) to plate‐bound ACE2 by soluble ACE2 (ACE2 + RBD) vs a control protein (Bet v 1 + RBD). (D) Effects of serum antibodies from COVID‐19 convalescent subjects (group B) and (E) from subjects obtained before the COVID pandemic (group P, historic controls) on the ACE2‐RBD interaction. Shown is the binding of RBD to ACE2 (y‐axis: OD values correspond to amounts of ACE2‐bound RBD) which had been pre‐incubated with sera or buffer without serum (Co) (x‐axis). Each result is an average of duplicate determinations with <5% difference between the two values. The grey bar indicates the area of no alteration of RBD binding to ACE2 including the 10% variability of the assay. The arrows pointing downwards from the grey bar indicate the extent of inhibition and the red line marks 50% inhibition of RBD binding to ACE2. The arrows point upwards of the grey bars show enhancement of RBD binding to ACE2
