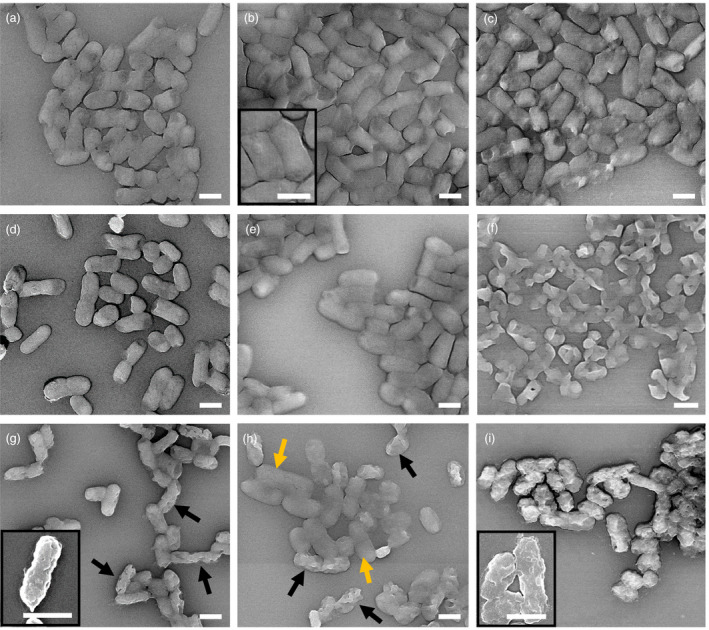
Figure 3.

SEM‐LABE images of Klebsiella aerogenes with and without CA at the three different pH values. (a–c) controls: (a) pH 4·5, (b) pH 6·5 and (c) pH 9·5; (d–f) 1% CA: (d) pH 4·5, (e) pH 6·5 and (f) pH 9·5; (g–i) 10% CA: (g) pH 4·5, (h) pH 6·5 and (i) pH 9·5. Inserts are close up SEM‐SEI images. Scale bars are 1 μm. Black arrows show damaged cells. Yellow arrows show healthy cells.
