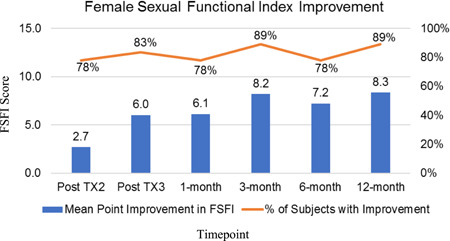
Fig. 7.

Point improvement in Female Sexual Functional Index (FSFI): the point improvement in FSFI scores at baseline, following treatment and at 1‐, 3‐, 6‐, and 12‐month follow‐up timepoints are shown for the postmenopausal study population. The orange graph indicates the percentage of subjects with a point‐improvement FSFI response at each timepoint (see Tables 8 and 9). FSFI point improvements statistically significant post TX3 through 12‐month follow‐up, *P < 0.03.
