
FIGURE 4.
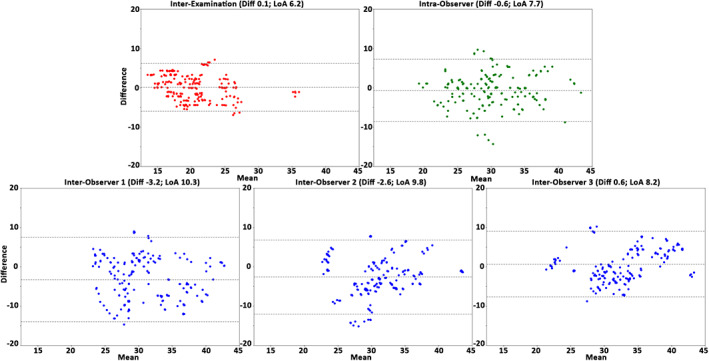
The Bland–Altman plots for centerline length assessment over the interexamination, intraobserver, and interobserver studies. Plots demonstrate the results of all healthy volunteers, anatomical segments, and cardiac phases (n = 250). Displayed on the vertical and horizontal axis, the difference and means, respectively, in mm. Horizontal lines show the mean difference (Diff, solid line) and the limits of agreement (LoA, dashed lines).