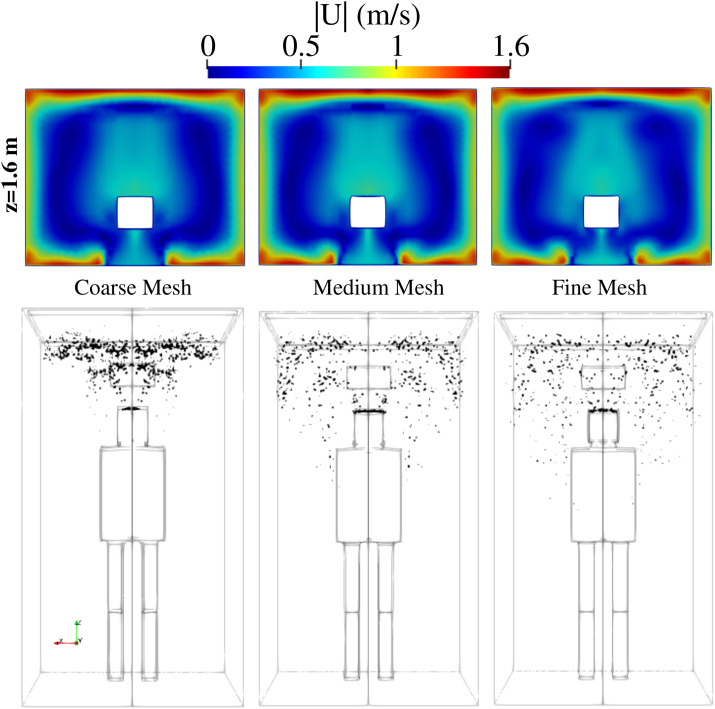
FIG. 2.
Scenario A—subject position 1. Mesh sensitivity analysis at t = 6 s. Top row: velocity magnitude in the plane z = 1.6 m. Bottom row: distribution of saliva droplets in space is illustrated in black after being scaled by a factor of about 250 with respect to their actual size. Fine mesh: 593 268 cells; medium mesh: 388 010 cells; coarse mesh: 284 850 cells. For the scenario A conditions, see Table I. Subject position 1 corresponds to a person who is standing in the elevator’s cabin such that her/his mouth as a coughing source is positioned at x = 0 m, y = 0.41 m, z = 1.6 m.

