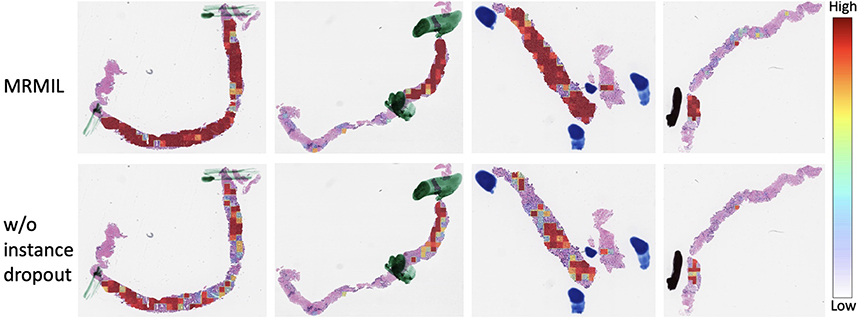
Figure 4:
WSIs overlaid with attention maps generated from the first stage cancer detection model. Pen marks as mentioned in Section 3.1 indicate cancerous regions. The first row shows attention maps from the model with instance dropout, while the second row is from the model without using instance dropout.

