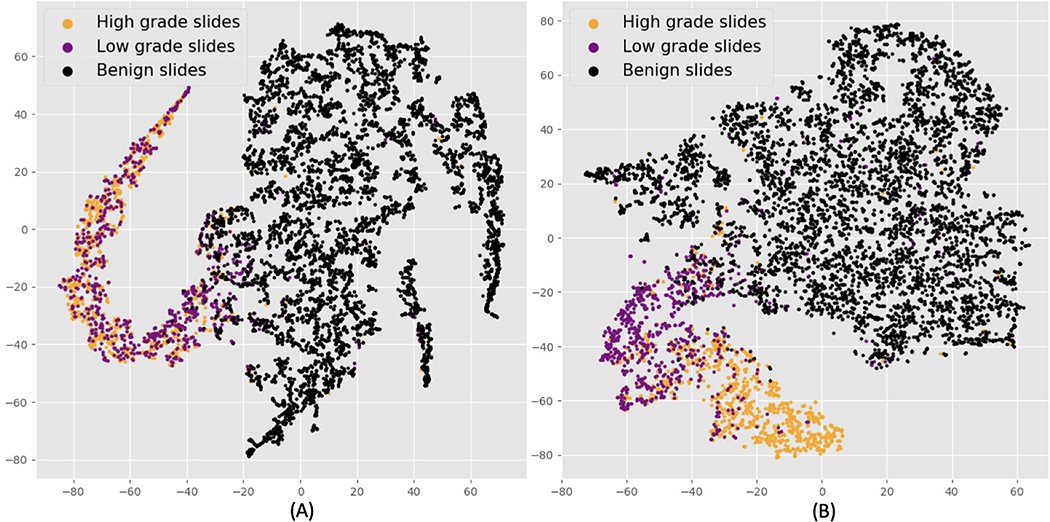
Figure 6:
t-SNE visualization of slide-level features. Black dots denote benign, purple dots indicate LG, and orange dots represent HG slides. (A) is the slide-level representations from the detection stage model. There is distinct separation between benign and cancerous slides. (B) shows the slide-level features from the classification stage model. We can see a better separation between LG and HG slides.

