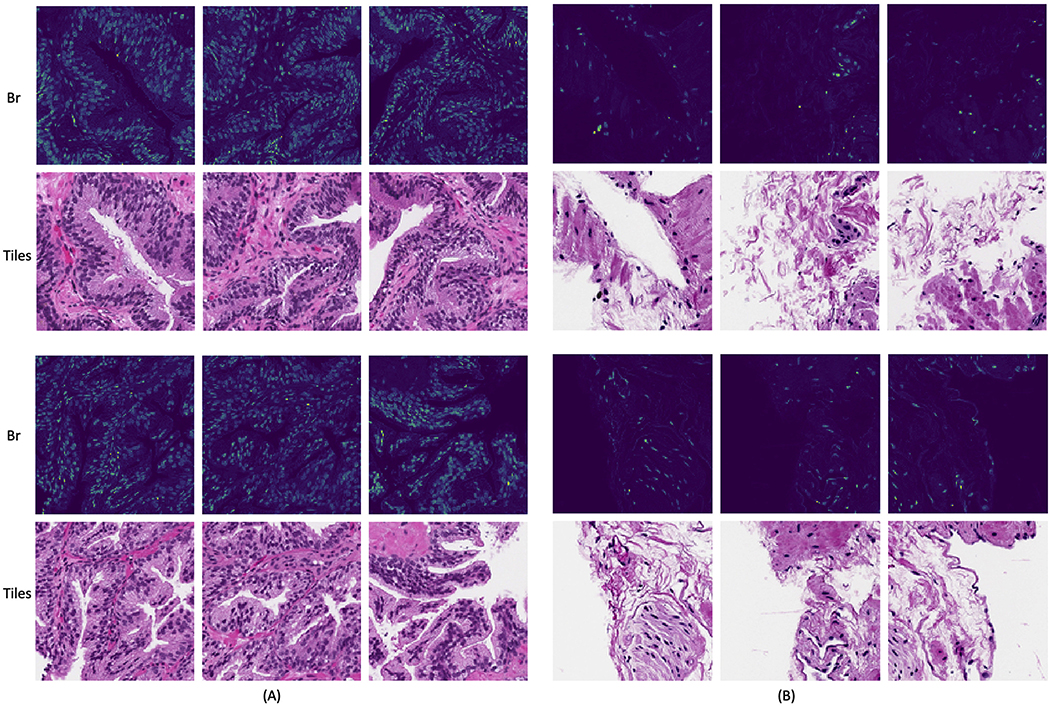
Figure 7.
Br conversion. We performed Br conversion for slides at 5x. The first two rows demonstrate tiles from a benign slide and the bottom two show ones from a malignant slide. (A) are 3 tiles with the highest average tile-level Br values, and (B) are ones with the lowest Br values. We can see that the br conversion is able to highlight regions with most nuclei.

