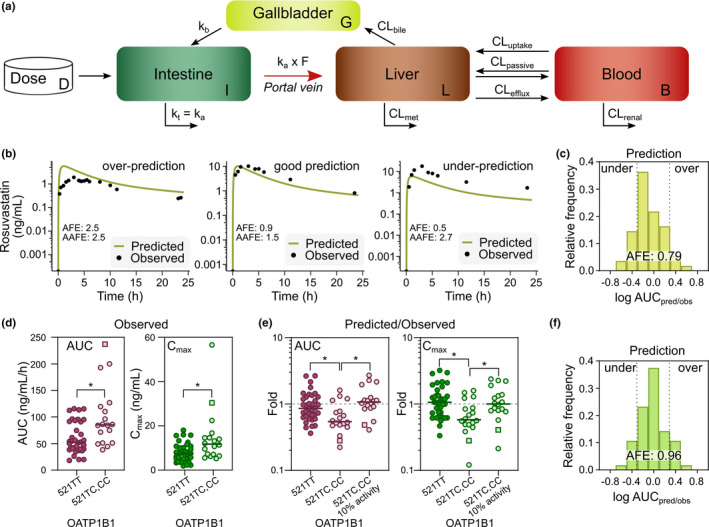
Figure 4.

Prediction of intrinsic hepatic rosuvastatin uptake clearance. (a) Schematics of the three‐compartment semimechanistic model 2. (b) Representative examples of underpredictions, good, and overpredictions of rosuvastatin plasma concentration profiles, using model 2 with gallbladder‐emptying rate optimized from 34 . (c) Frequency distribution of rosuvastatin area under the plasma concentration versus time curve (AUC) predicted/observed fold errors across the 54 patients (model 2). Dotted lines represent twofold underprediction and overprediction. (d) Observed AUC and peak plasma concentration (Cmax) values from rosuvastatin plasma concentration profiles, separated by patients carrying the OATP1B1 521TT and OATP1B1 521TC,CC variants (square symbolizes the carrier of the 521CC allele). (e) Fold values from predicted and observed AUC and Cmax from the semimechanistic model, separated by patients with OATP1B1 521TT and OATP1B1 521TC,CC variants before (model 2) and after correcting for the 521C 10% reduced activity (model 3). 10 (f) Frequency distribution of rosuvastatin AUC predicted/observed fold errors across the 54 patients after adjusting for the 521C 10% reduced activity, where dotted lines represent twofold underprediction and overprediction (model 3). *P < 0.05, Kruskal–Wallis test followed by Dunn’s multiple comparisons test. AUC (ng/mL/h); Cmax (ng/mL); terminal half‐life (t 1/2) (h). CL, clearance. [Colour figure can be viewed at wileyonlinelibrary.com]
