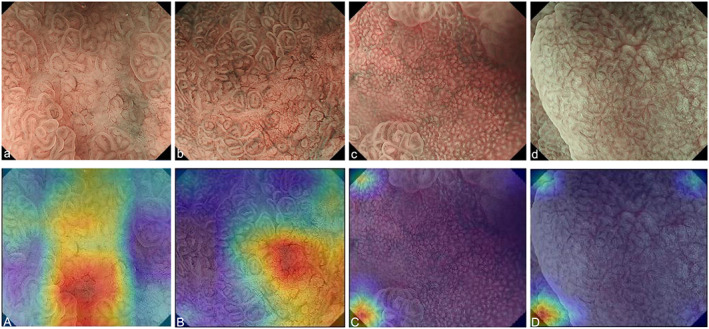
Figure 3.

Heatmap of occlusion analysis. (a) Differentiated‐type cancer (0‐IIc, tub1). (b) Differentiated‐type cancer (0‐IIc, tub1). (c) Patchy redness. (d) Adenoma. (A–D) Heatmaps of each lesion. 0‐IIc, flatly depressed; tub1, well differentiated adenocarcinoma.
