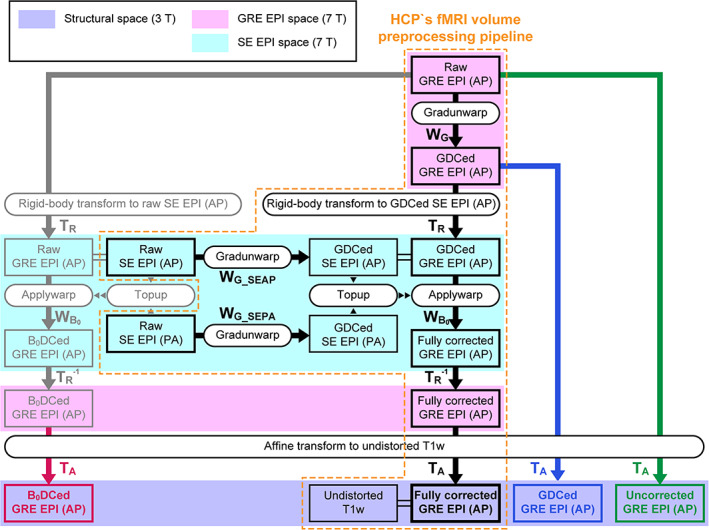
FIGURE 1.

Flow chart of the Human Connectome Project (HCP) pipeline and its modification. A zone surrounded by an orange dotted line indicates the process of the HCP's functional MRI (fMRI) volume preprocessing pipeline. The pipeline fully corrects the distortion of the gradient‐echo (GRE) echo‐planar imaging (EPI) images with the anterior‐to‐posterior (AP) phase‐encoding direction to register to an undistorted T1‐weighted (T1w) structural image. Boxes indicate output images by a process, and rounded boxes indicate script names. Black arrows indicate the application of the warp field (W) or transform matrix (rigid‐body transform; T R or affine transform; T A) to images. W with subscripts G and B 0 shows that the warp field is for gradient distortion correction (GDC) and B0 distortion correction (B0DC), respectively. W with subscripts G_SEAP and G_SEPA indicates that the warp field is applied to correct raw spin‐echo (SE) images acquired with AP and PA (posterior‐to‐anterior) phase‐encoding directions for gradient distortion, respectively. Transform matrices with the superscript –1 indicate that the matrices are inverse ones. Purple, magenta, and aqua zones denote 3T structural, 7T GRE EPI, and 7T SE EPI spaces. Different “T A”s were generated for registration of fully corrected GRE EPI (black), raw GRE EPI (green), gradient distortion‐corrected (GDCed) EPI (blue), and B0 distortion‐corrected (B0DCed) GRE EPI (red).
