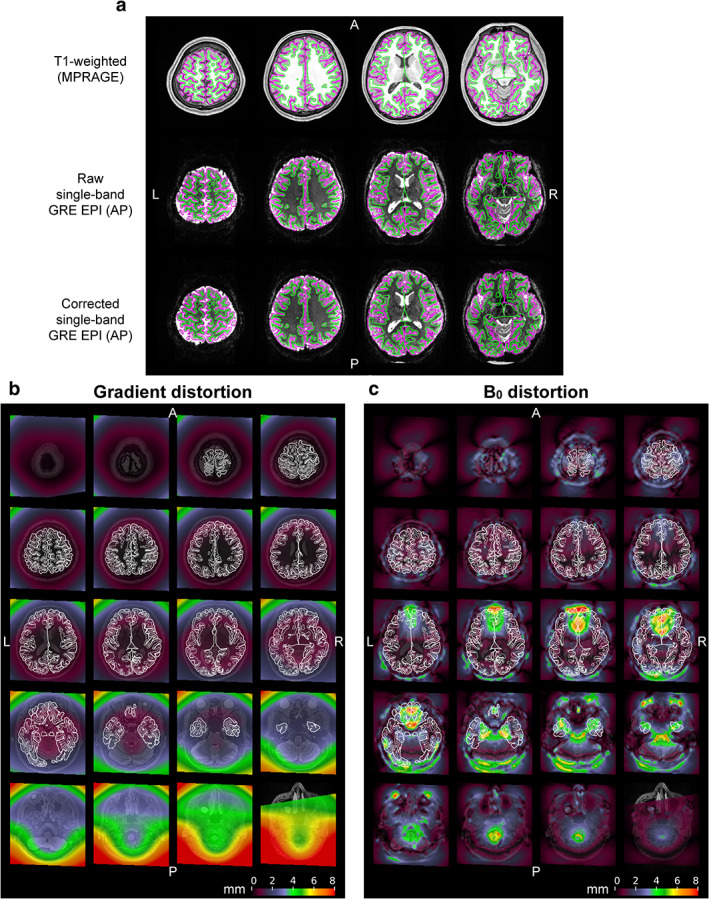
FIGURE 4.

Distortions of echo‐planar images. (a) Raw and corrected echo‐planar images are compared with a structural image at four slice positions in a subject. A T1‐weighted structural image acquired at 3T is shown in the first row. In the second row, a raw single‐band (SB) gradient‐echo (GRE) EPI image acquired with the anterior‐to‐posterior (AP) phase‐encoding direction at 7T is registered onto the structural image (first row). An echo‐planar image in which distortion corrections are applied to the raw one (second row) is registered in the third row. Green and magenta lines denote white and pial surfaces created with FreeSurfer. The amount of distortions induced by gradient nonlinearity and B0 inhomogeneity are shown in (b,c), respectively. Colors on these maps indicate how much distortion each position in the brain experiences in the raw echo‐planar image in mm. Thin and thick white lines denote the same white and pial surfaces, respectively.
