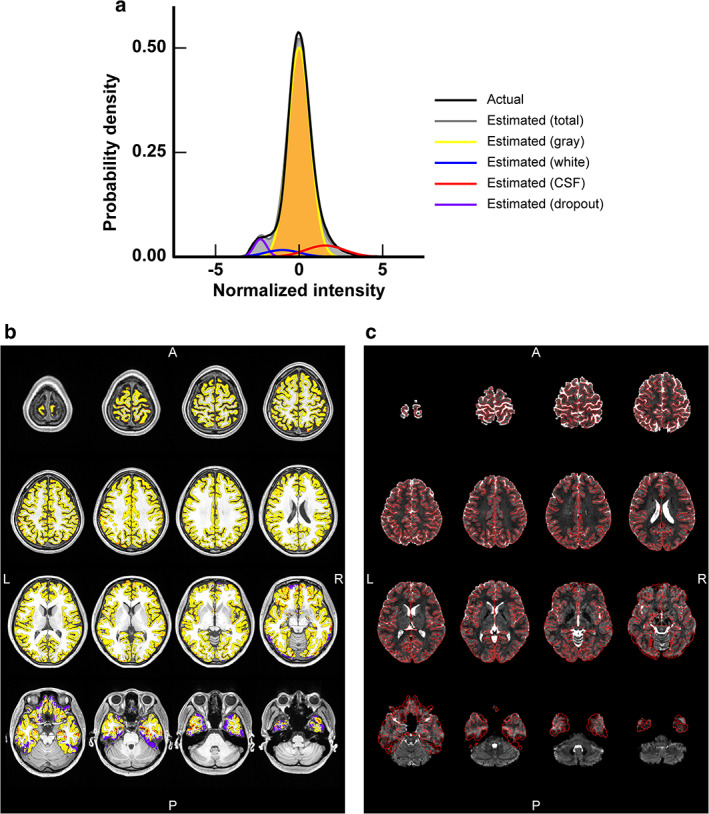
FIGURE 5.

Evaluation of distortion correction accuracy of a distortion‐corrected gradient‐echo (GRE) echo‐planer image in a typical subject. (a) A normalized intensity histogram of voxels of a single‐band (SB) GRE echo‐planer image (c) that locate within a cortical ribbon defined by structural images is shown as a probability density. The black curve is an actual distribution of the voxel intensity, while the gray one is the total estimated distribution by summing estimated distributions of gray and white matter, cerebrospinal fluid (CSF), and intensity dropout (denoted by yellow, blue, red, and purple curves, respectively). (b) The spatial distribution of voxels that are categorized into the four types (gray and white matter, CSF, and intensity dropout) based on fitting to the normalized intensity histogram is shown on a T1‐weighted structural image. Voxel colors are the same as in (a). (c) The SB GRE EPI image used for the estimation is shown with borders of the cortical ribbon (red lines).
