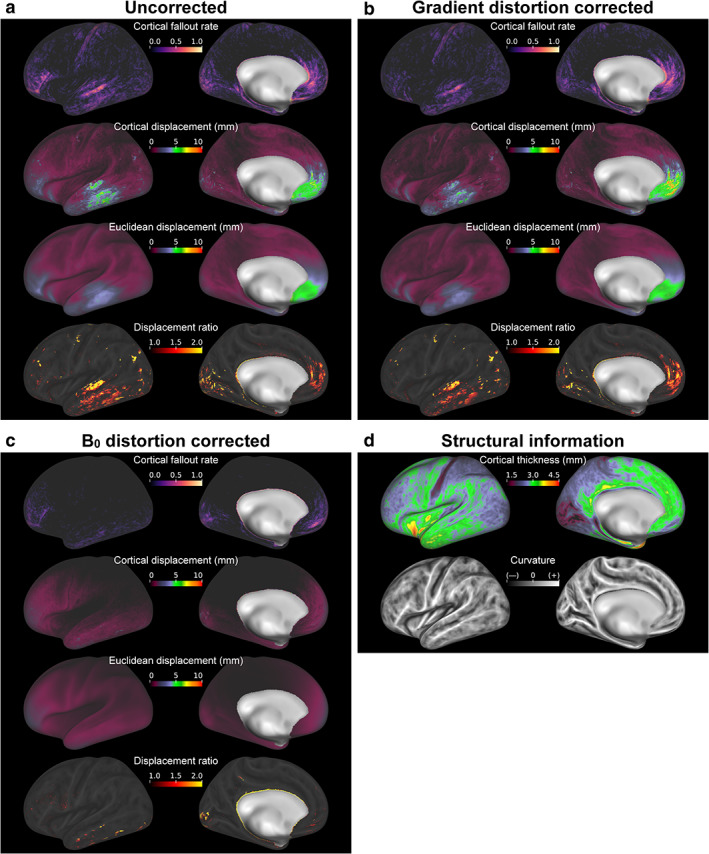
FIGURE 6.

Group‐averaged effects of distortion corrections on the cortical surface‐based analysis. Panels (a,b,c) correspond to the effects in case that echo‐planar images acquired with the anterior‐to‐posterior phase‐encoding direction were registered to the structural image, with no correction, gradient distortion correction (GDC), and B0 distortion correction (B0DC), respectively. Maps of the cortical fallout rate, cortical displacement, Euclidean displacement, and displacement ratio are shown in the first to fourth rows of each panel. The fallout rate maps indicate how frequently each vertex was categorized as data from extracortical voxels. Additionally, maps of cortical thickness and curvature averaged over 15 subjects are shown in (d).
