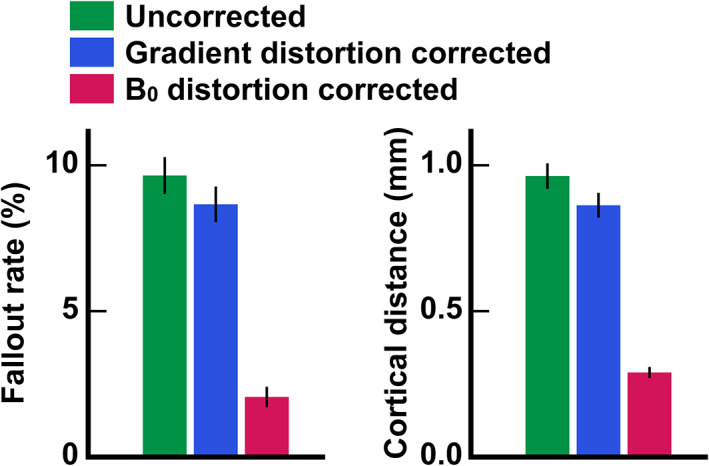
FIGURE 7.

Group‐averaged cortical fallout rates and displacements across vertices in three distortion conditions. Post‐hoc paired t‐tests for 15 subjects indicated significant differences in both the cortical fallout rate and displacement among the conditions. Error bars indicate standard errors of the mean across subjects.
