
Figure 3.
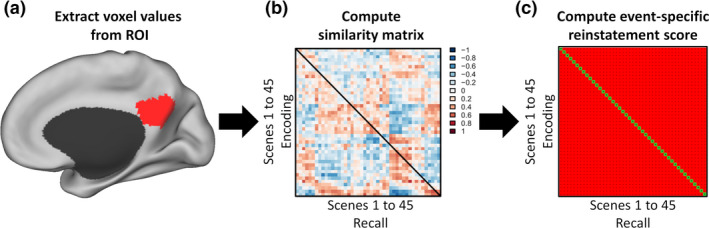
Schematic representation of the analytic procedure involved in using representational similarity analysis to measure memory reinstatement from movies. Following preprocessing, brain activity in regions of interest (ROIs) is averaged per voxel over time, resulting in a single brain image representing the overall brain activity for each individual scene, at both encoding and recall. For instance, illustrated in panel (a) is the PCC ROI, where pattern reinstatement was the highest in Oedekoven et al. (2017). Next, voxel values in the ROI for each scene during encoding are correlated with the corresponding voxel values for all the scenes during recall. The resulting correlation coefficients can then be converted into a normal distribution (with scores ranging from −1 to 1) using Fischer’s r to z transformation and plotted in a similarity matrix. Panel (b) illustrates a 45 × 45 similarity matrix (based on made‐up data suggestive of a strong memory reinstatement), in which each cell represents a correlation coefficient. Values on the diagonal represent the correlations between brain activity during encoding and recall of the same scene while non‐diagonal values indicate correlations between different scenes. Event‐specific reinstatement scores can then finally be computed, as illustrated in panel (c), by calculating the differences between the diagonal values indicated in green and non‐diagonal values indicated in red. Event‐specific scores that are significantly greater than zero indicate a pattern reinstatement during recall of the brain activity during encoding for the ROI considered. The PCC ROI in panel (a). is displayed on the PALS‐B21 inflated surface map using CARET software (Van Essen, 2005).