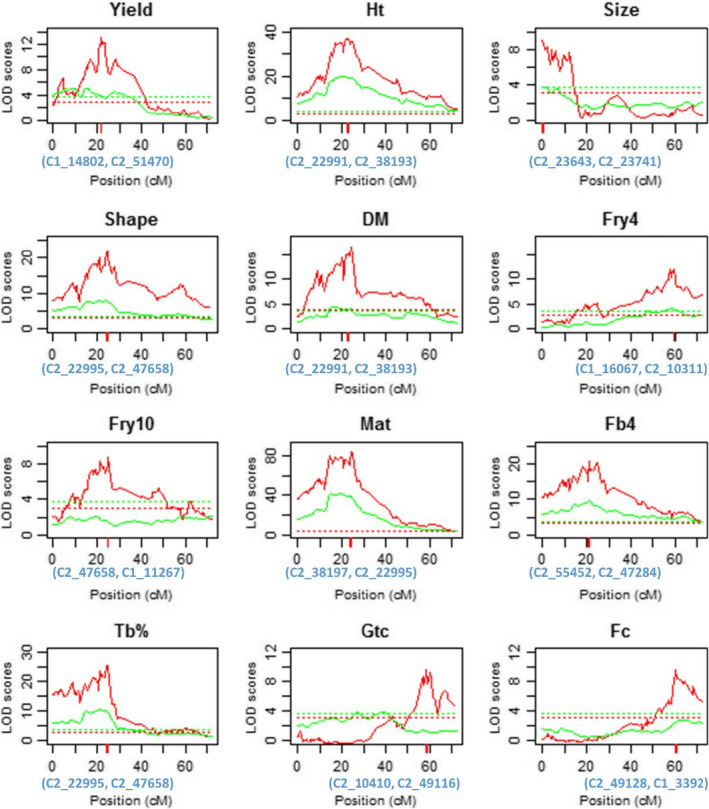
Figure 1.

Logarithm of odds (LOD) score profiles of quantitative trait loci (QTLs) mapped on potato chromosome V for 12 agronomic traits of autotetraploid potato (Solanum tuberosum). The LOD score profiles were derived from QvMethod (red lines) and H2017 (green lines). The dotted lines represent the corresponding significance thresholds from 100 permutation tests. The red bars indicate the most likely chromosomal locations of the QTLs detected by QvMethod, and listed on the chromosomal x‐axes are the markers closest to the detected QTLs. The 12 traits are yield (fresh tuber weight in kilograms per plot), Ht (canopy height), size (tuber), shape (tuber), DM (dry matter), Fry4 and Fry10 (frying colour at 4°C and 10°C), Mat (maturity), Fb4 (foliage blight), Tb% (tuber blight), Gtc (Globodera pallida cyst counts), and Fc (flower colour). H2017 represents the method developed in Hackett et al. (2017).
