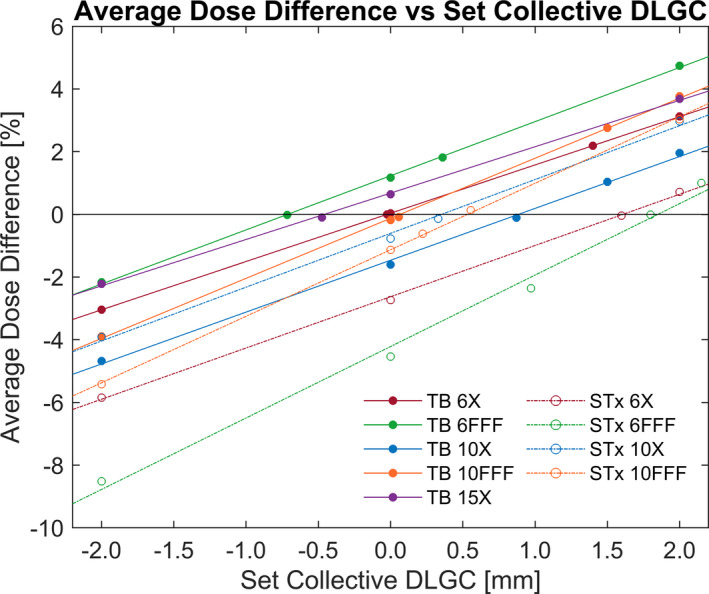
FIG. 2.

Average Dose Difference vs. Collective DLGC. The average dose difference relative to measurements across all seven test plans for a given collective DLGC, machine, and energy. The optimal collective DLGC for each machine/energy was determined by fitting the data linearly and identifying the value for 0.0% absolute average dose difference. Each data point represents the percent difference averaged across the seven test plans.
