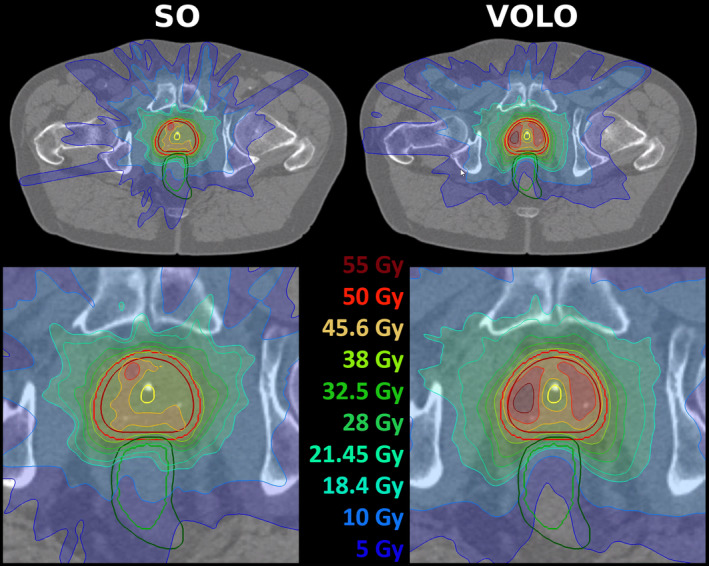
FIG. 4.

Upper panels: example of dose distributions (SO – left, VOLO™ ‐ right) for a prostate patient. Patient 19 was chosen as the dose difference between SO and VOLO™ in rectum D0.03cc was for this patient closest to population average. Structures shown are: prostate and PTV – red, rectum – green and urethra – yellow. For both plans, the lower panel shows a zoomed area around the prostate.
