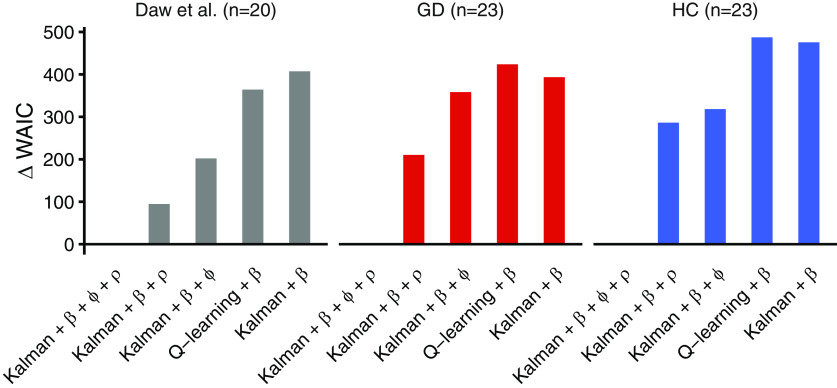
Figure 2.
Results of the model comparison based on the WAIC. Plotted are WAIC differences between each model and the best-fitting model, such that smaller values indicate a superior fit. Across a re-analysis of behavioral data from Daw et al. (2006; n = 20), gamblers (GD, n = 23), and matched healthy controls (HC; n = 23) a Kalman filter model with uncertainty bonus (φ) and perseveration bonus (ρ) accounted for the data best.

