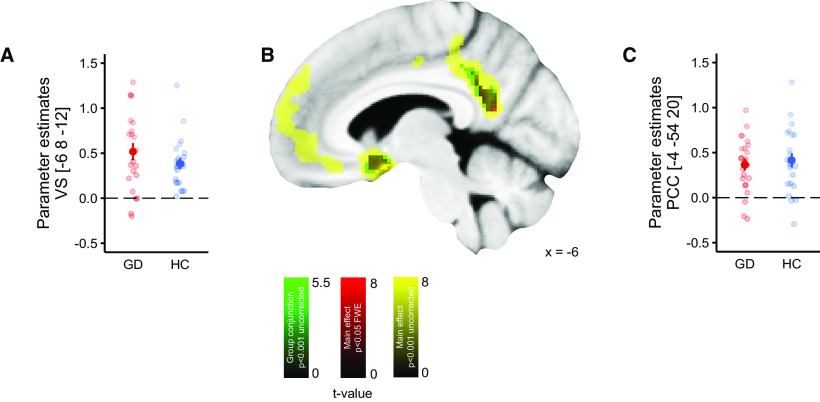
Figure 4.
Neuronal correlates of outcome value (points received). A, Extracted β estimates of each participant in the Ventral striatum (VS), peak coordinate of the main effect. B, Display of the main effect value; yellow, p < 0.001 (uncorrected); red, whole-brain FWE corrected p < 0.05; green, conjunction GD and HC p < 0.001 (uncorrected). C, Extracted β estimates of each participant in the PCC, peak coordinate of the main effect. Error bars denote SEM.

