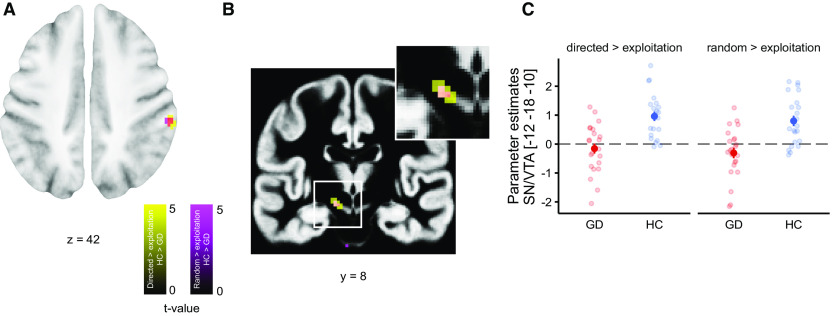
Figure 6.
Group differences in the neuronal correlates of directed exploration versus exploitation. A, Greater activation for controls versus gamblers in the parietal cortex, p < 0.001 (uncorrected). B, Greater activation for healthy controls compared with gamblers in the SN/VTA, p < 0.001 (uncorrected). C, Parameter estimates per participant from the peak voxel of B. Note that the group difference was observed for both directed and random exploration versus exploitation. Error bars denote SEM.

