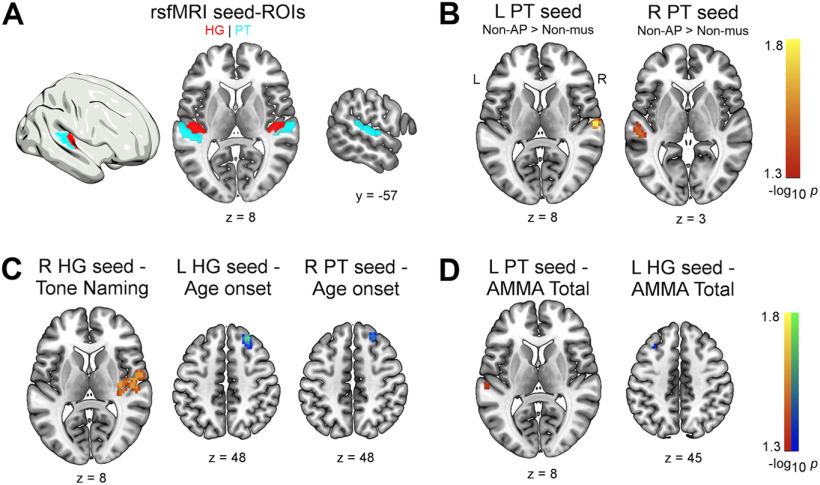
Figure 1.
A, Auditory ROIs used in the rsfMRI seed-to-voxel analyses. Red represents HG. Sky blue represents PT. Maps for ROIs were derived from the probabilistic Harvard-Oxford cortical atlas as implemented in DPABI. B, Increased intrinsic functional connectivity between left and right PT in non-AP musicians compared with non-musicians (pFWE < 0.05). C, Associations between functional connectivity and behavior in musicians and (D) across all subjects (pFWE < 0.05). L, Left; R, right.

