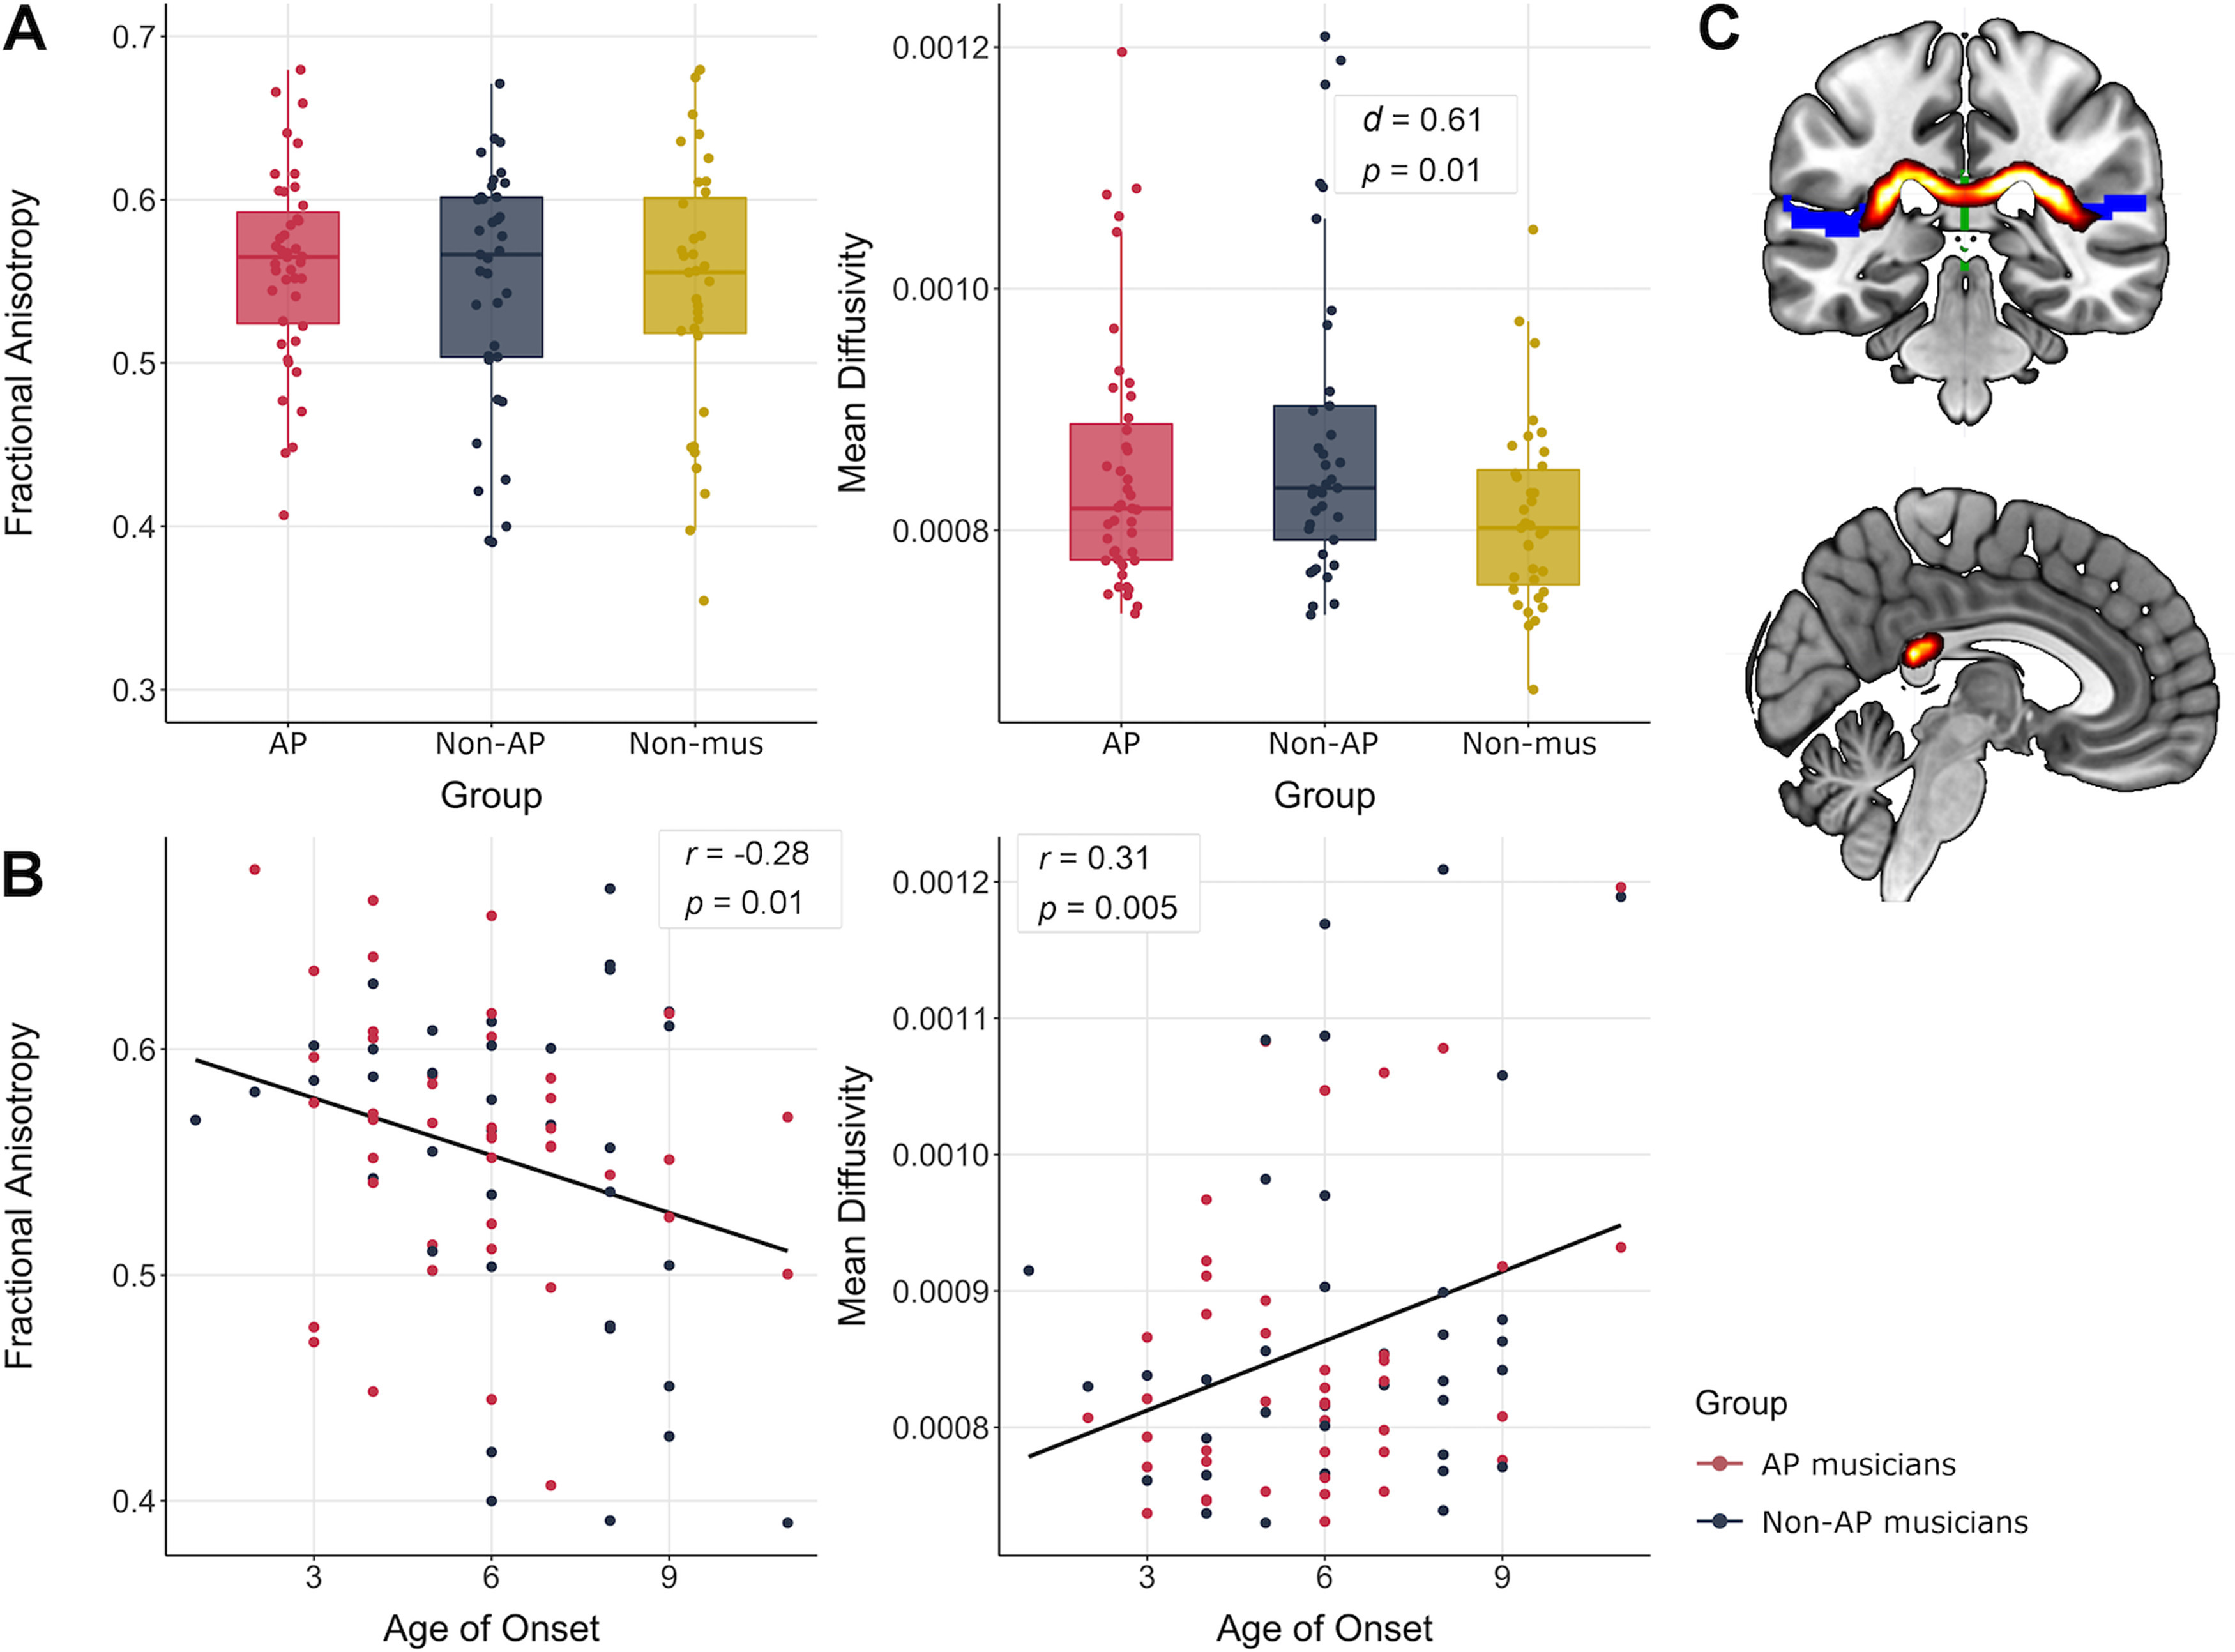
Figure 6.

A, Group differences between AP, non-AP, and non-musicians (Non-mus) in FA and MD values (α = 0.025, adjusted for multiple diffusion measures). B, Associations between FA and MD values and age of onset of musical training. C, Coronal and sagittal view of the mean white-matter pathway between left and right PT obtained by probabilistic tractography across all subjects.
