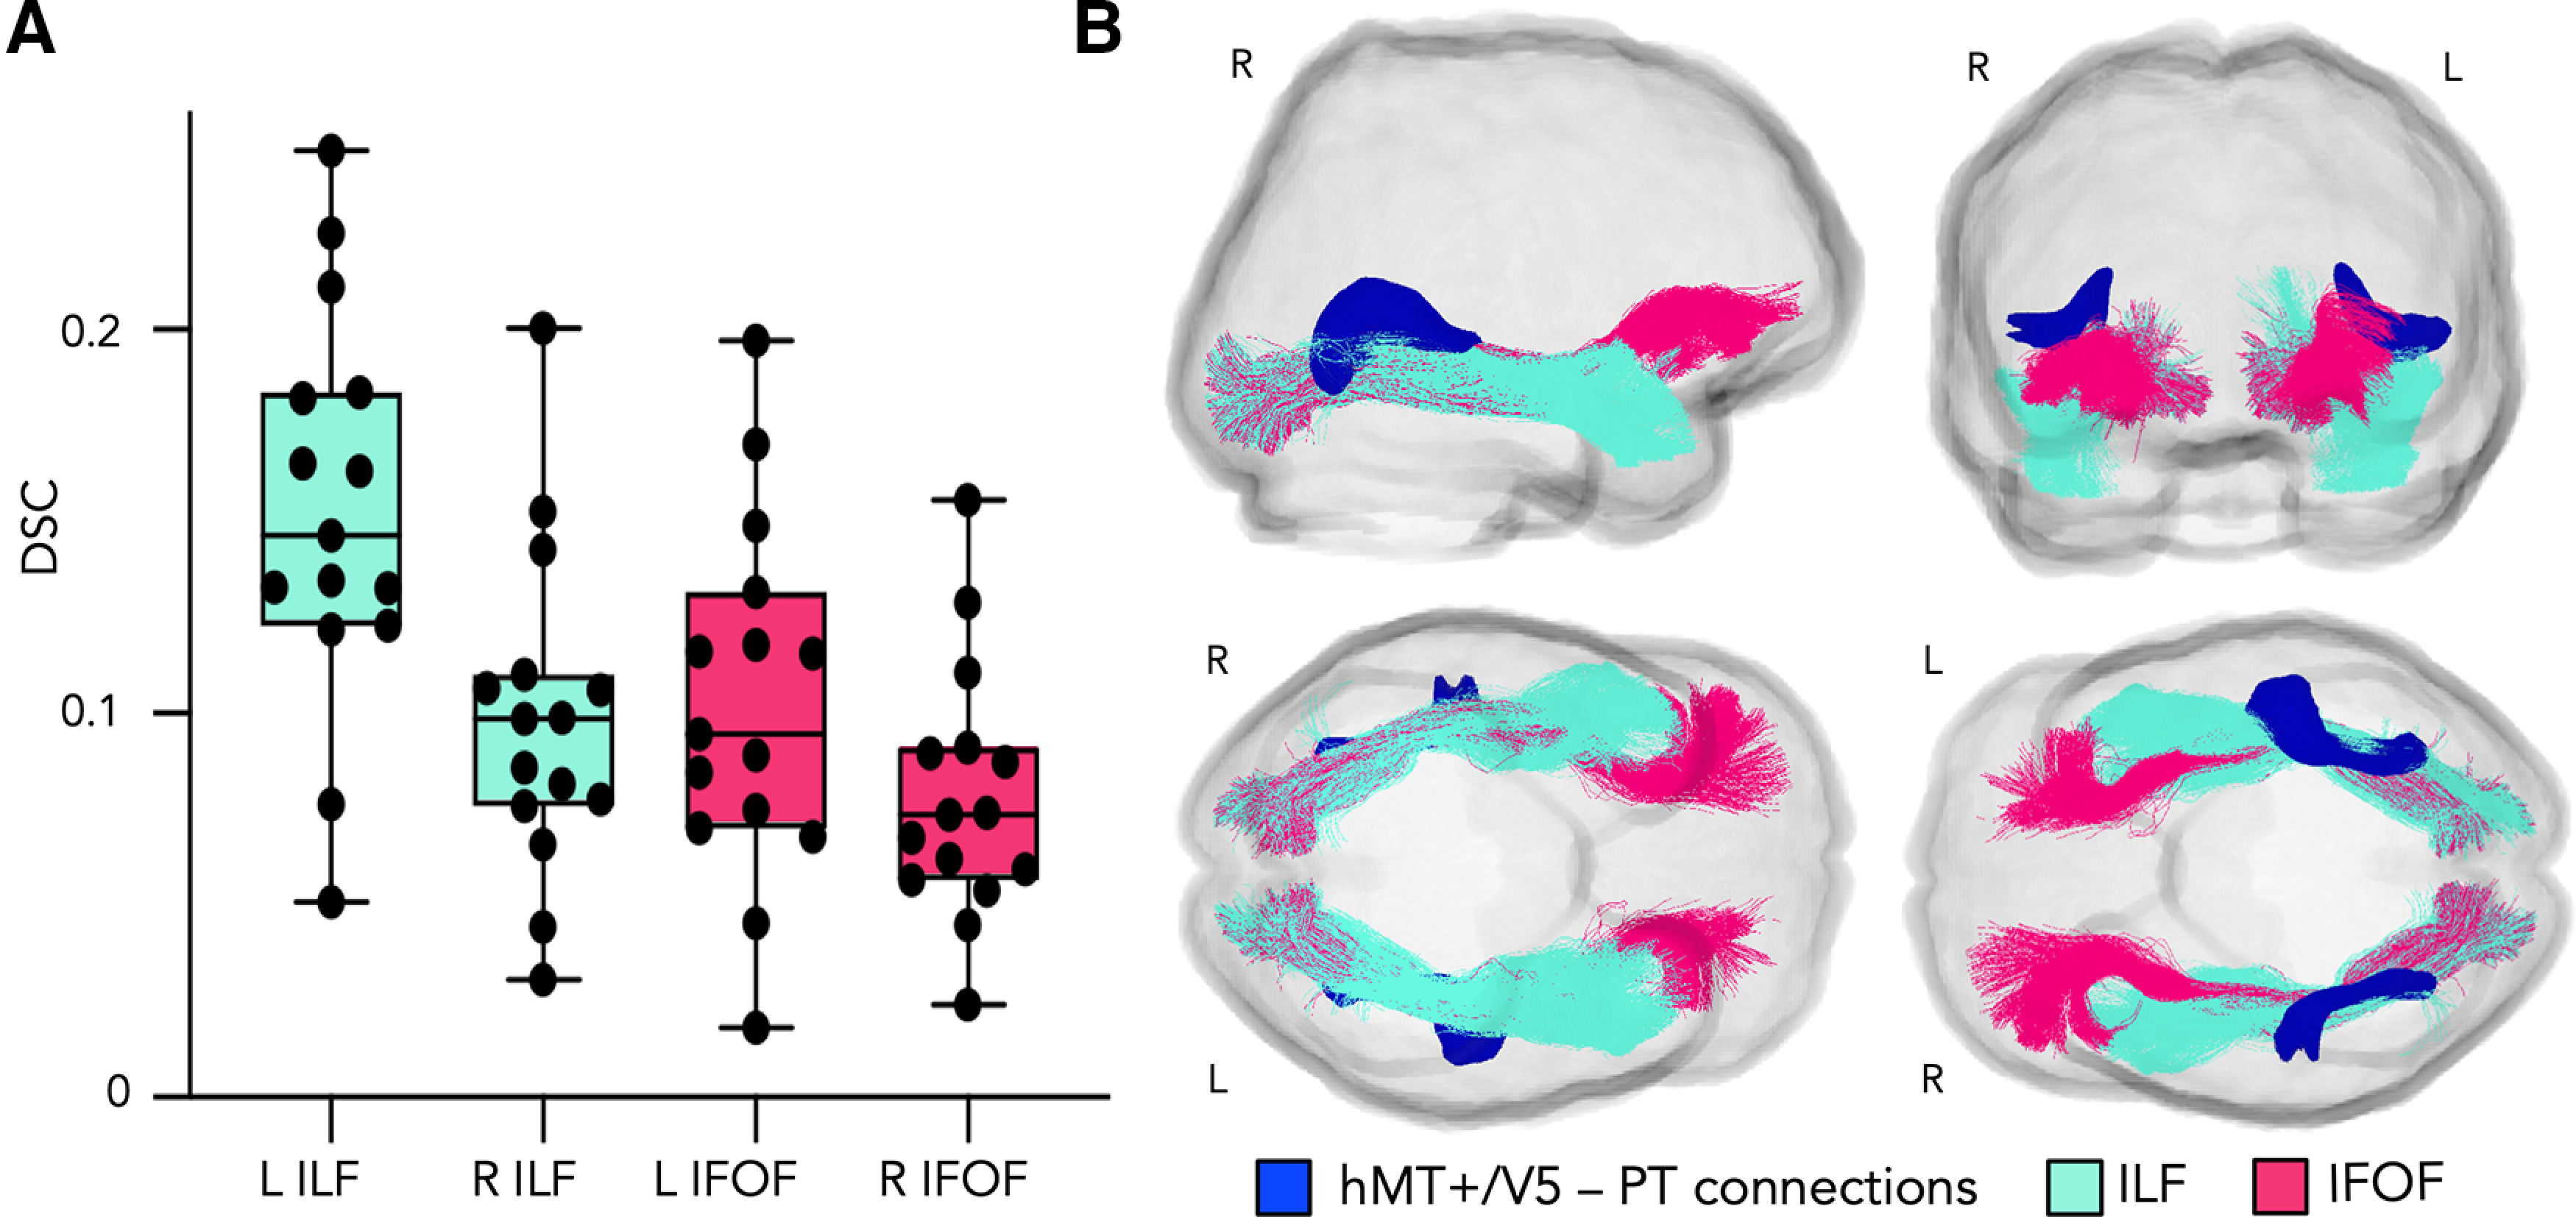
Figure 2.

A, Boxplots represent DSCs between individual hMT1/V5 -hPT connections and the ILF (turquoise) and the IFOF (pink). Dots represent individual DSC values. R, Right; L, left. B, Position of hMT+/V5–hPT connections (dark blue) relative to the left ILF (turquoise) and the left IFOF (pink). Sagittal view from the right hemisphere, coronal view from the anterior part of the brain, and axial view from the inferior (bottom left) and superior (bottom right) parts of the brain. ILF and IFOF dissected in our population template following the two-ROI approach described by Wakana et al. (2007). hMT+/V5–hPT connections shown at a threshold of >9 subjects. Results are shown on the template diffusion space. R, Right; L, left.
