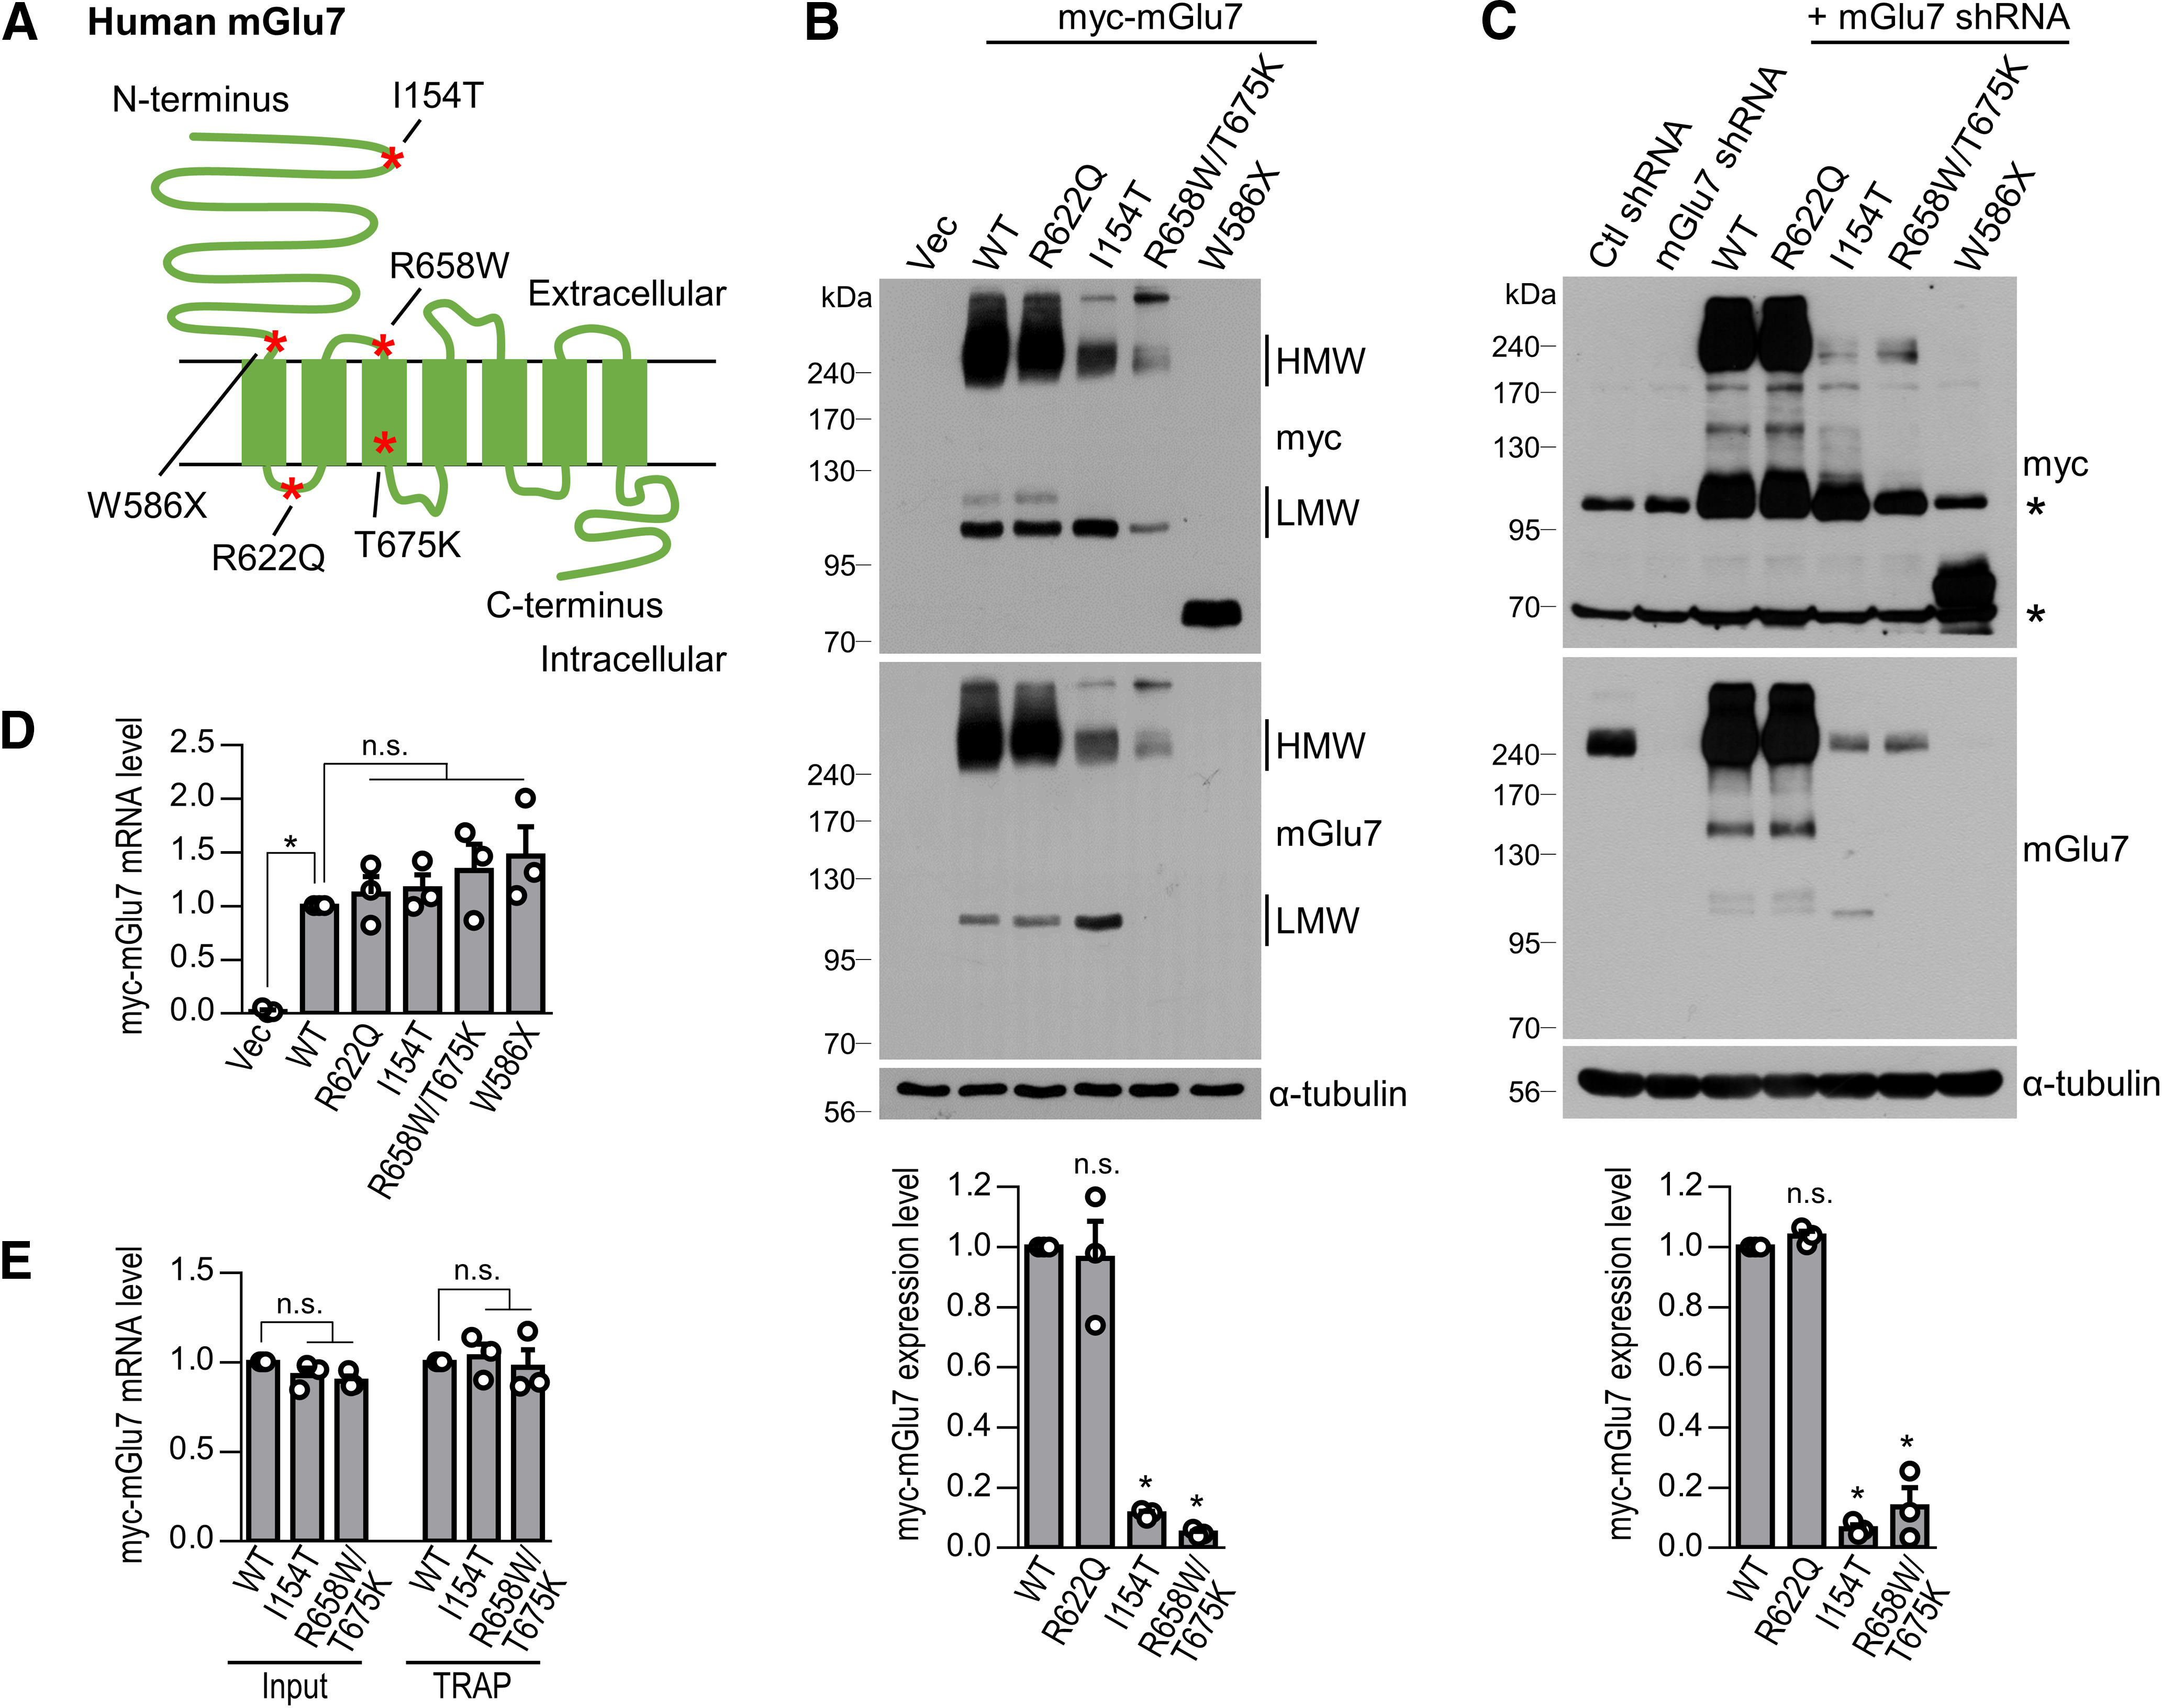
Figure 1.

Expression of human GRM7 variants identified in NDD patients. A, Schematic diagram shows the location of the GRM7 pathologic variants identified in NDD patients. B, HEK 293T cells were transfected with myc-tagged human mGlu7 WT, R622Q, I154T, R658W/T675K, or W586X. Western blotting was performed with anti-myc or anti-mGlu7 antibodies. Note that the epitope of the anti-mGlu7 antibody is located at the extreme C terminus of mGlu7a; therefore, the anti-mGlu7 antibody did not recognize W586X, a truncated mutant of mGlu7. The HMW (>200 kDa) and LMW (∼100 kDa) forms of mGlu7 are labeled. Vec, vector control. Bar graph with scatter plots represent the mean ± SEM of the expression levels of HMW myc-mGlu7; n.s., not significant, *p < 0.0001. C, Lentivirus-mediated rescue expression of human myc-mGlu7 WT and variants. Endogenous rat mGlu7 was knocked down by shRNA, and human myc-mGlu7 WT, R622Q, I154T, R658W/T675K, or W586X were expressed with the same vector in DIV10 cortical neurons. At DIV17, Western blotting was performed with the indicated antibodies. Asterisks denote nonspecific bands. Bar graph with scatter plots represent the mean ± SEM of the expression levels of HMW myc-mGlu7; n.s., not significant, *p < 0.0001. D, After lentivirus-mediated infection, the mRNA expression levels of GRM7 WT or mutants in DIV3 cortical neurons were analyzed by real-time RT-PCR. Relative mRNA expression was calculated by the 2-ΔΔCT method using GAPDH as an internal control. Bar graph with scatter plot represents mean ± SEM, n.s., not significant, p = 0.0086. E, The efficiency of GRM7 mRNA translation was analyzed by TRAP assay. EGFP-tagged Rpl10a was cotransfected with the GRM7 variants into HEK 293T cells. The cell lysates were immunoprecipitated with anti-GFP antibody, and the bound mRNA was isolated. The amount of GRM7 mRNA bound to ribosomes was determined by a real-time RT-PCR assay. Input indicates the amount of total GRM7 mRNA. Bar graph with a scatter plot represents the mean ± SEM, n.s., not significant.
