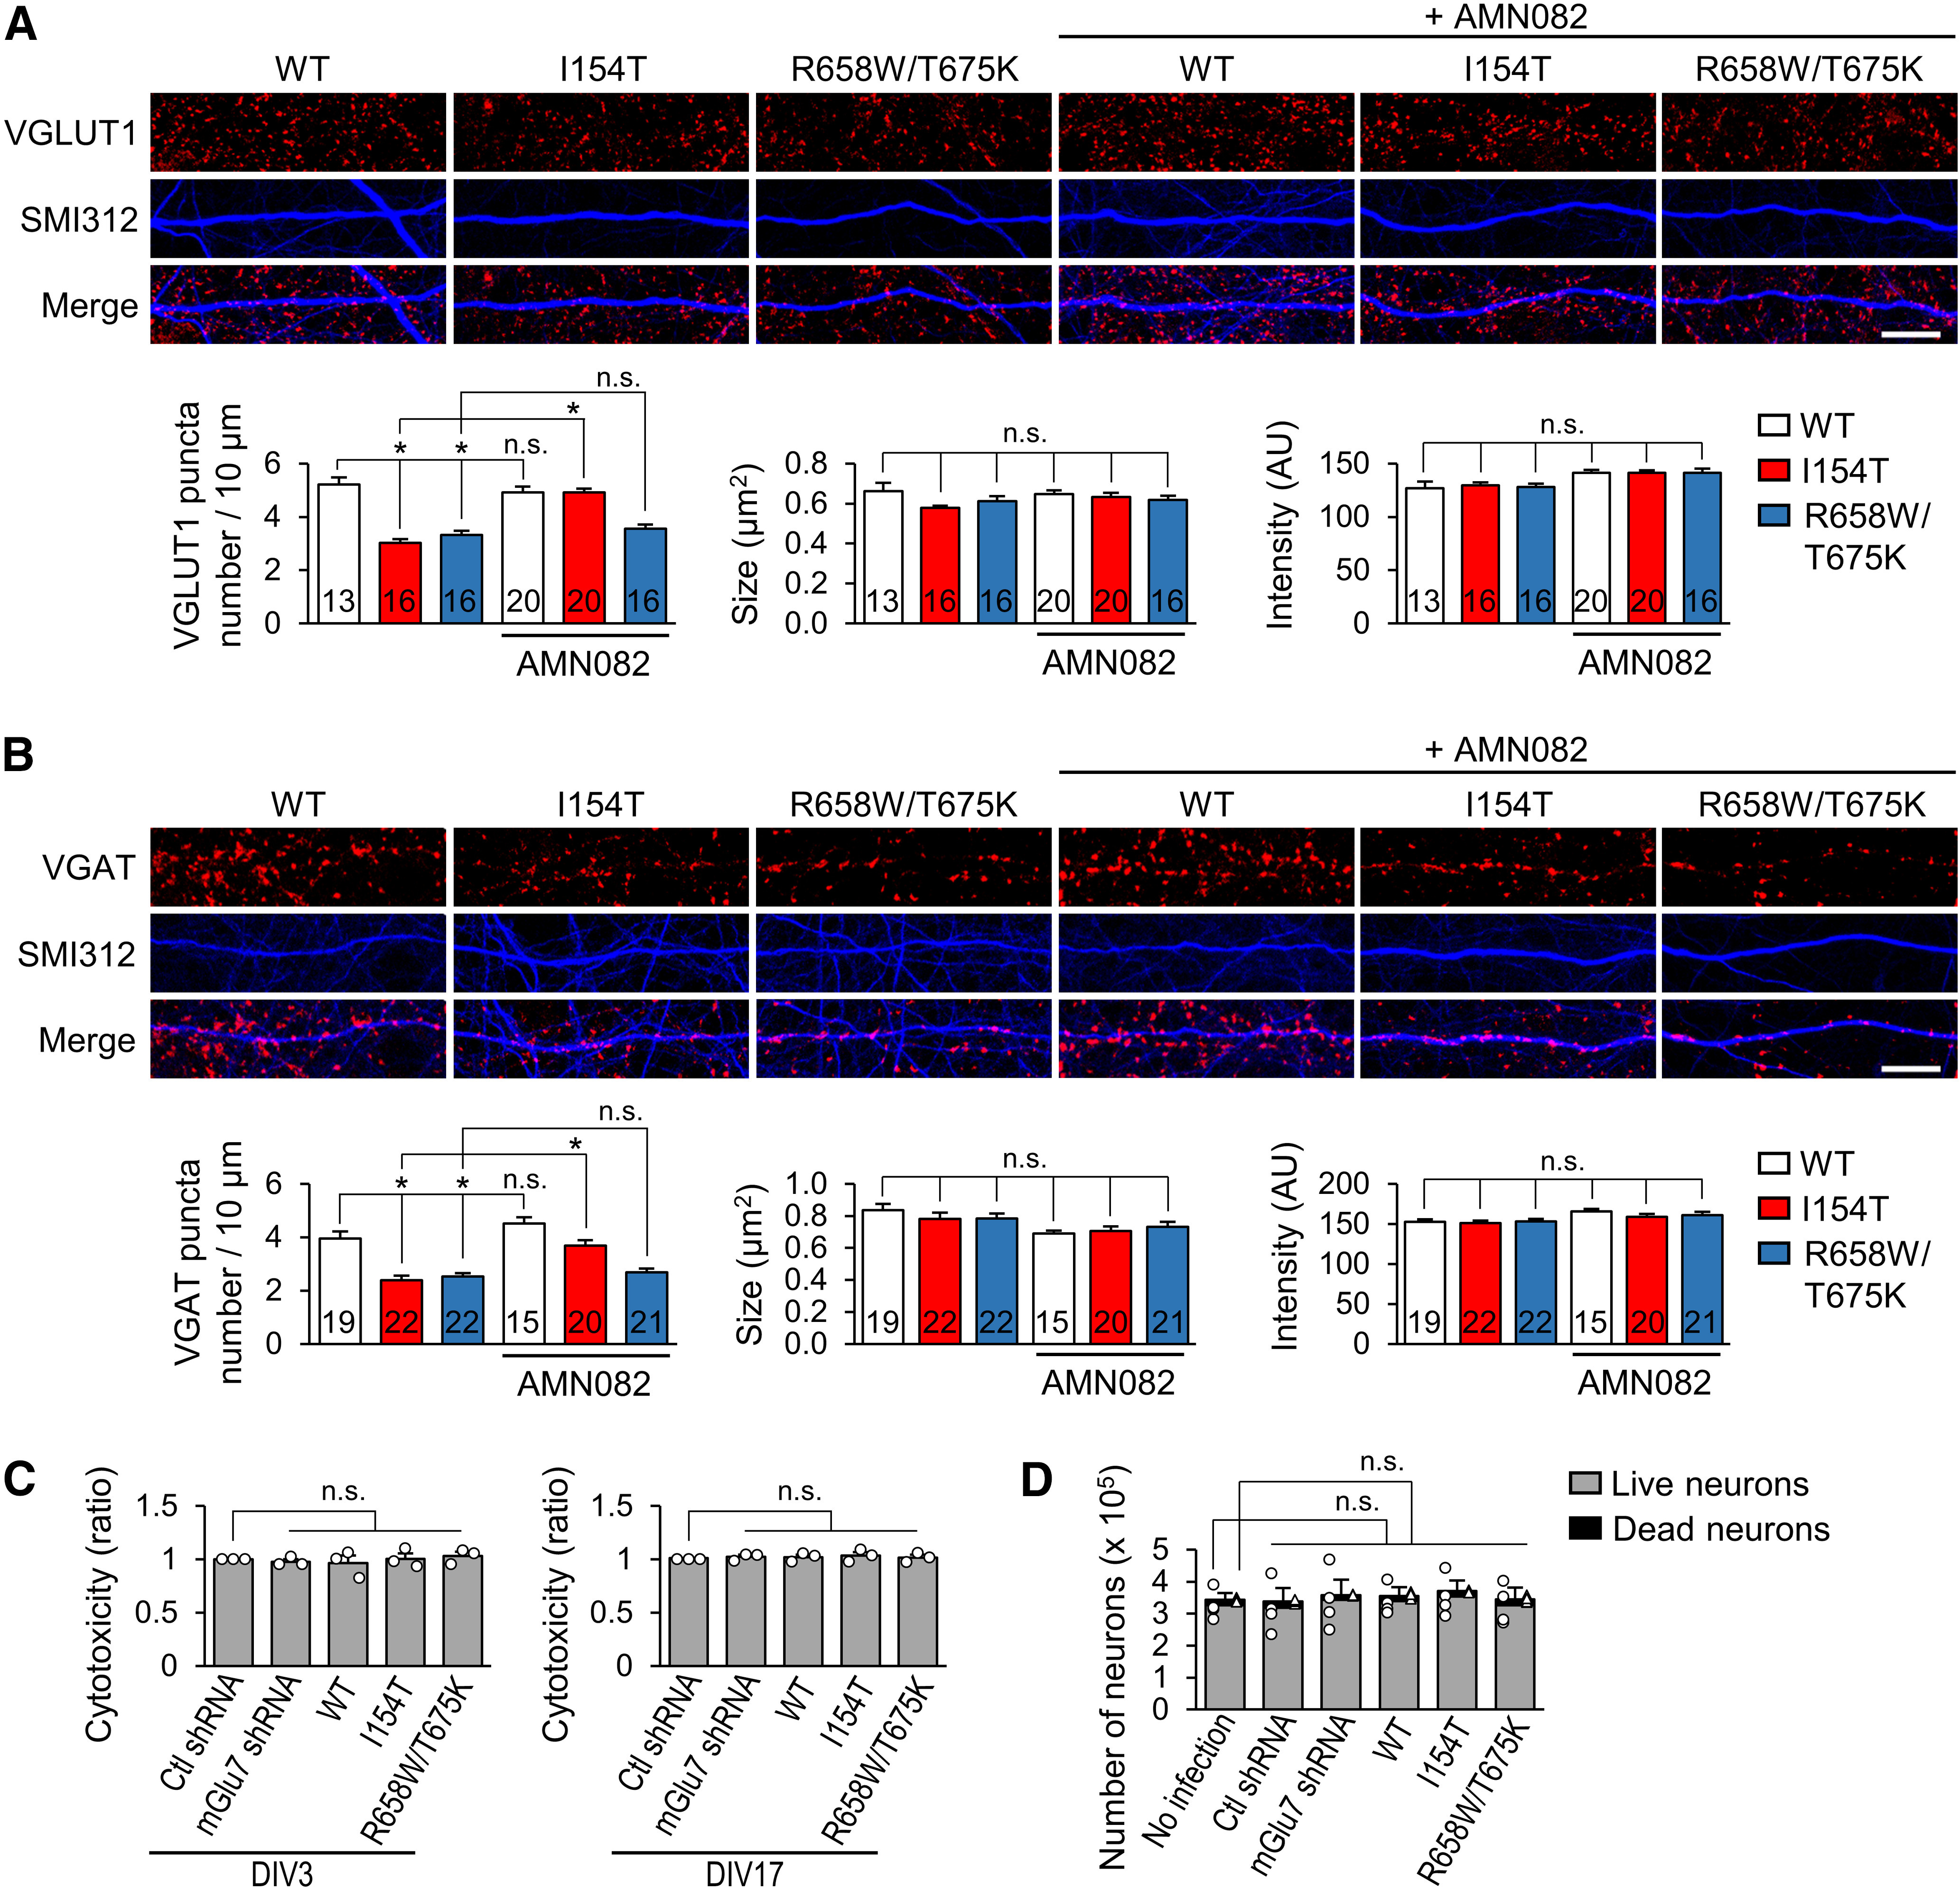
Figure 9.

Presynaptic terminal development is deficient on expression of the mGlu7 rescue variants, and AMN082 restores the defect induced by mGlu7 I154T. A, Hippocampal neurons (DIV1) were infected with rescue lentivirus expressing mGlu7 WT, I154T, or R658W/T675K. Twenty-four hours after infection, the neurons were treated with AMN082. At DIV17, the neurons were permeabilized and immunostained with anti-VGLUT1 (red) and SMI312 (pseudo-blue) antibodies. Scale bar: 10 μm. Bar graphs show a summary of the effects of mGlu7 variants on the number of VGLUT1-positive puncta per 10-µm axon (left), size of the VGLUT1-positive puncta (middle), and intensity of the VGLUT1-positive puncta (right). The number in the bar indicates the total number of neuron analyzed. AU, arbitrary unit. Bar graphs represent mean ± SEM, n.s., not significant, *p < 0.0001. B, Hippocampal neurons were infected as shown in panel A and immunostained with anti-VGAT (red) and SMI312 (pseudo-blue) antibodies. Scale bar: 10 μm. Summary graphs show the effect of the GRM7 variants on the number of VGAT-positive puncta per 10-µm axon (left), size of the VGAT-positive puncta (middle), and intensity of the VGAT-positive puncta (right). The number in the bar indicates the total number of neurons analyzed. AU, arbitrary unit. Bar graphs represent mean ± SEM, n.s., not significant, *p < 0.0001. C, Cell viability was measured using an LDH cytotoxicity colorimetric assay in DIV3 (left panel) or DIV17 (right panel) hippocampal neurons infected with the indicated virus. Bar graph with scatter plots represent the mean ± SEM, n.s., not significant. D, After staining the neurons (DIV3) with AO/PI, the number of live neurons and the number of dead neurons in one well of a six-well culture plate were automatically counted using Cellometer K2. Bar graph represents the mean ± SEM. Scatter plots with open circle and triangle represent the live neuron number and dead neuron number, respectively; n.s., not significant.
