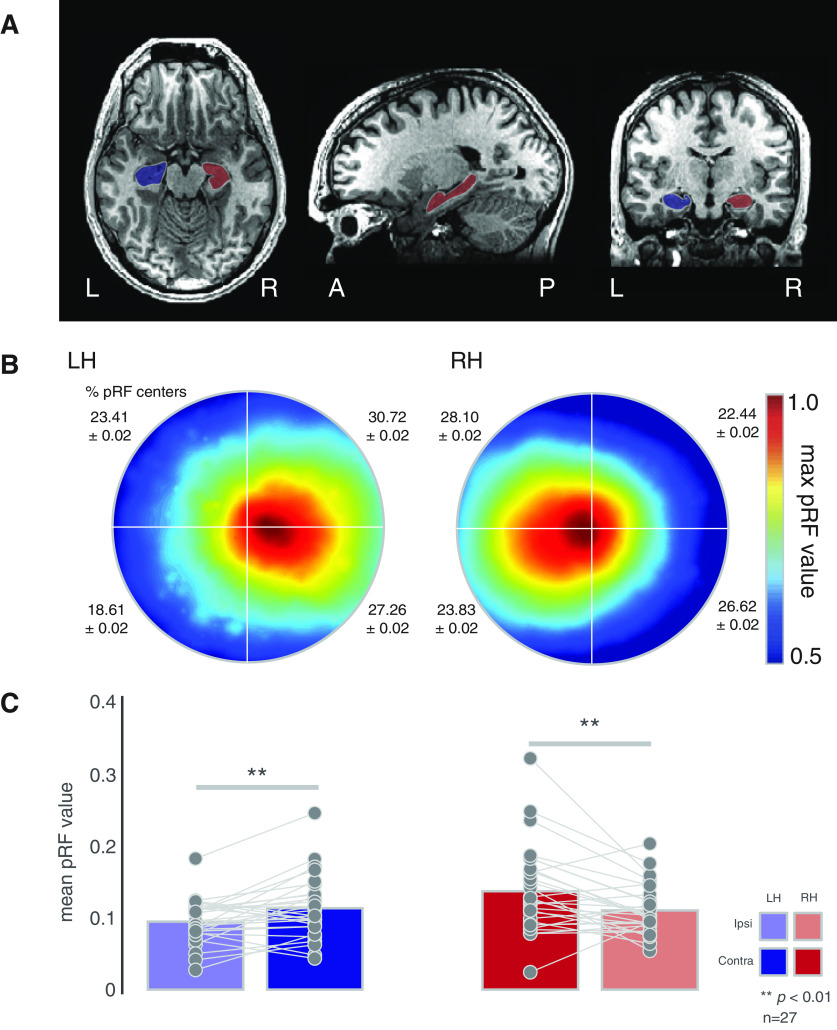
Figure 1.
Contralateral biases in human hippocampus. A, Masks of the left (blue) and right (red) hippocampus of a representative participant. Images are in neurologic convention. B, Group average (n = 27) visual field coverage plots derived from all suprathreshold (R2 > 0.1) voxels. A clear contralateral bias is evident in bilateral hippocampus. The mean percentage and SD of pRF centers in each quadrant is shown inset. C, Quantification of contralateral biases. Bars represent the group-average pRF value in the ipsilateral (faded bars) and contralateral (solid bars) visual fields. Individual participant values are plotted and linked for each hippocampus. On average a significant contralateral bias was present in both hemispheres; **p < 0.01.

