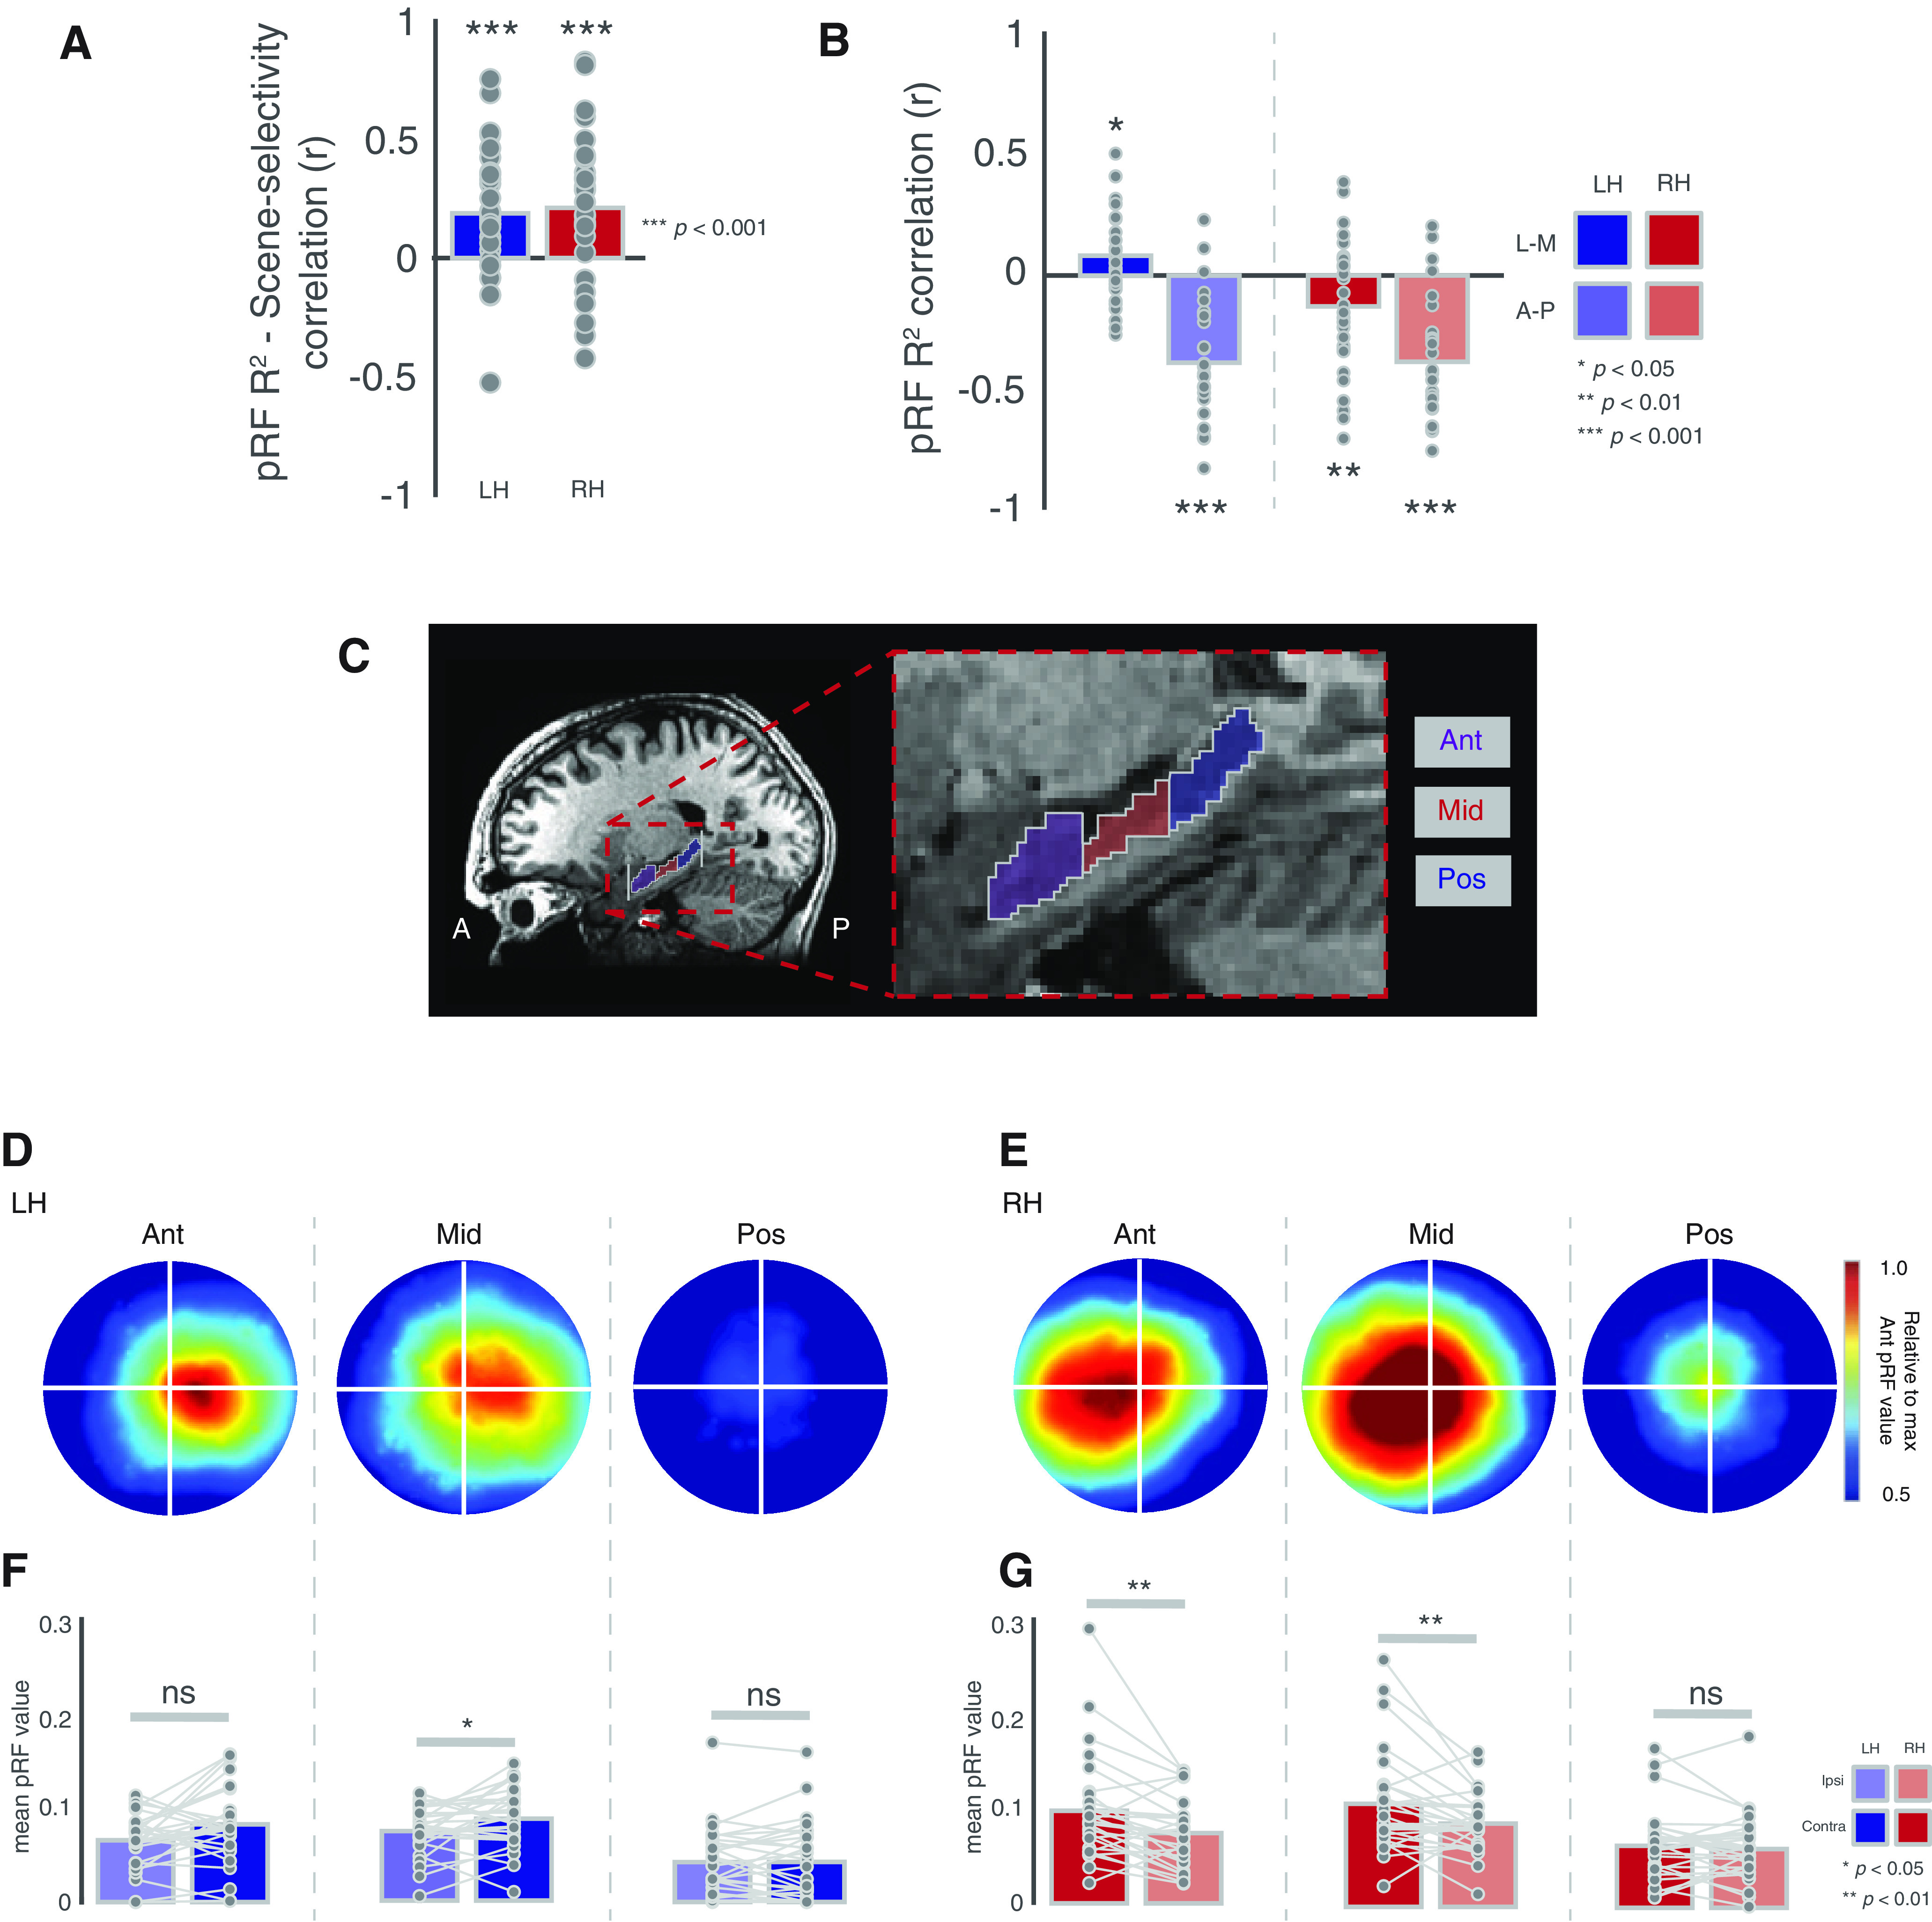
Figure 2.

Relationship with scene-selectivity and contralateral biases in hippocampal sections. A, Bars represent the group-average correlation (Pearson's) between pRF R2 and scene-selectivity across voxels. B, Bars represent the group average correlation between pRF R2 and position along the lateral-medial (solid bars) and anterior-posterior (faded bars) axes. C, Enlarged view of the hippocampus showing the anterior, middle, and posterior sections. D, Group average visual field coverage plots derived from all suprathreshold (R2 > 0.1) voxels in each hippocampal section in the left hemisphere. E, Same as D but for the right hemisphere. F, Bars represent the group-average pRF value in the ipsilateral (faded bars) and contralateral (solid bars) visual fields for each section in the left hippocampus. G, Same as F but for the right hippocampus; *p < 0.05, **p < 0.01, ns = not significant..
