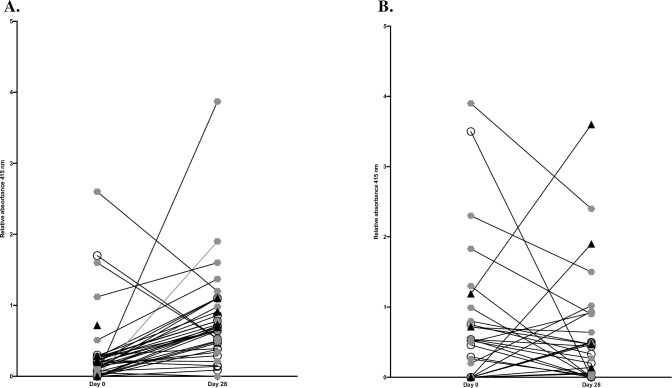
Fig 1. Relative levels of absorbance from day 0 to day 28.
Relative levels of absorbance of IgG (1A) and IgA (1B) against SARS-CoV-2, separated on the three study groups were compared from day 0 and day 28. Group 1 represent patients with mild disease, group 2 include patients with moderate disease and group 3 encompass patients with severe COVID-19. White circle indicates group 1, grey hexagon indicates group 2 whereas black triangle defines group 3.

