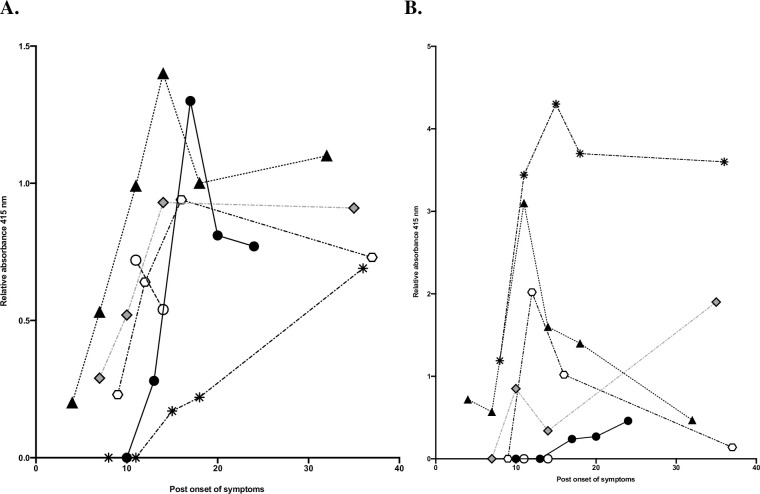
Fig 4. Relative levels of absorbance and post onset of symptoms.
Relative levels of absorbance for IgG (4A) and for IgA (4B) for each patient in group 3, and relation to post onset of symptoms were compared. Each color and symbol shape represents a patient, black and white circles represent values from the two patients who deceased during the study period. Triangle indicates values from the one patient who required treatment at ICU.

